
Audit Page
Last updated: 18 August 2026
The Audit Page is the final verification checkpoint for your carbon inventory. It shows every transaction with full calculation detail — emission factors, confidence scores, source files — and lets you filter, edit, and export the data for auditors. Navigate to Analyse > Audit Page.
What Each Row Shows
Each row is a single transaction or data entry in your carbon inventory. By default, the table shows:
- Date — The transaction date
- Facility name — The node this entry is linked to
- GHG category — Which emissions category (e.g., purchased goods and services, electricity)
- Scope — Scope 1, 2, or 3
- Description — Always includes how the calculation was performed
- Supplier name — The vendor or provider
- AI confidence — For AI-classified entries, the confidence score behind the classification
- Emissions — The calculated CO₂e value
- Emission factor — Which factor was applied
- Source file — Click to go directly to the uploaded file
You can customise which columns are displayed — NetNada has 22+ fields available, including activity, activity units, emission factor category, emission factor database, and more.
AI Confidence Scores
Wherever AI has classified an entry or matched it to an emission factor — spend-based purchases, business travel, waste — NetNada records a confidence score on the line. The Carbon Ledger carries an AI Confidence column so you can see the score against every row, with the bands explained in a tooltip. The scores are colour-coded:
| Level | Colour | Action |
|---|---|---|
| High (≥90%) | Green | Strong match — usually safe to proceed |
| Medium (70–89%) | Amber | Review recommended to ensure accuracy |
| Low (<70%) | Red | Manual review required for compliance accuracy |
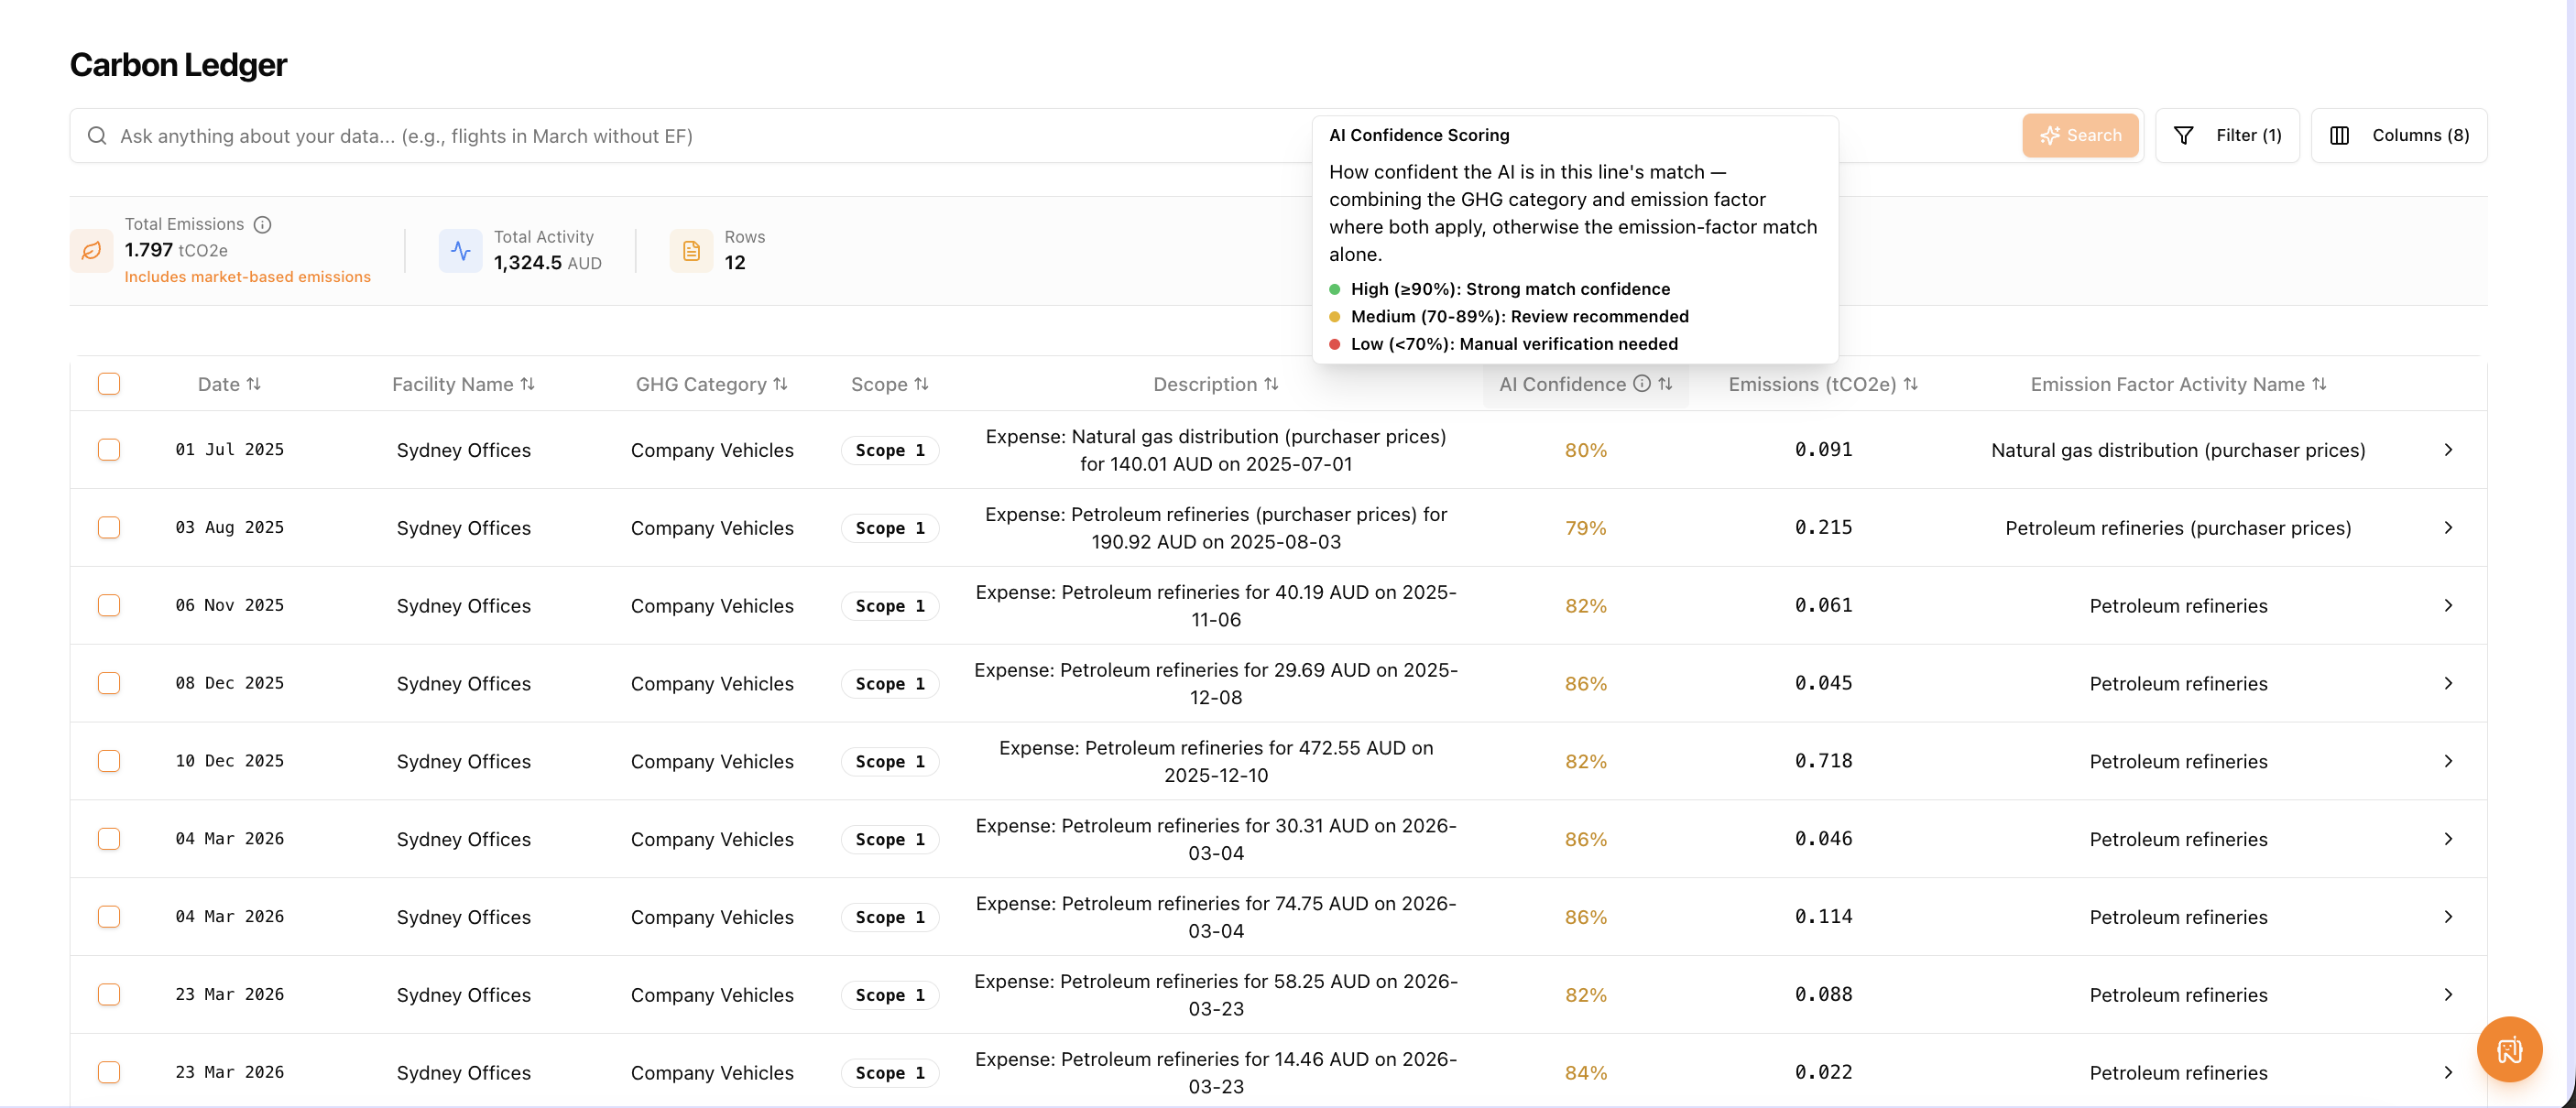
Expand a row to see how the score was built. The AI rates two things separately: how well the entry matched its greenhouse gas category, and how well it matched the emission factor applied. The breakdown sits alongside the factor, its source and its dataset, so you can see exactly what drove the score.
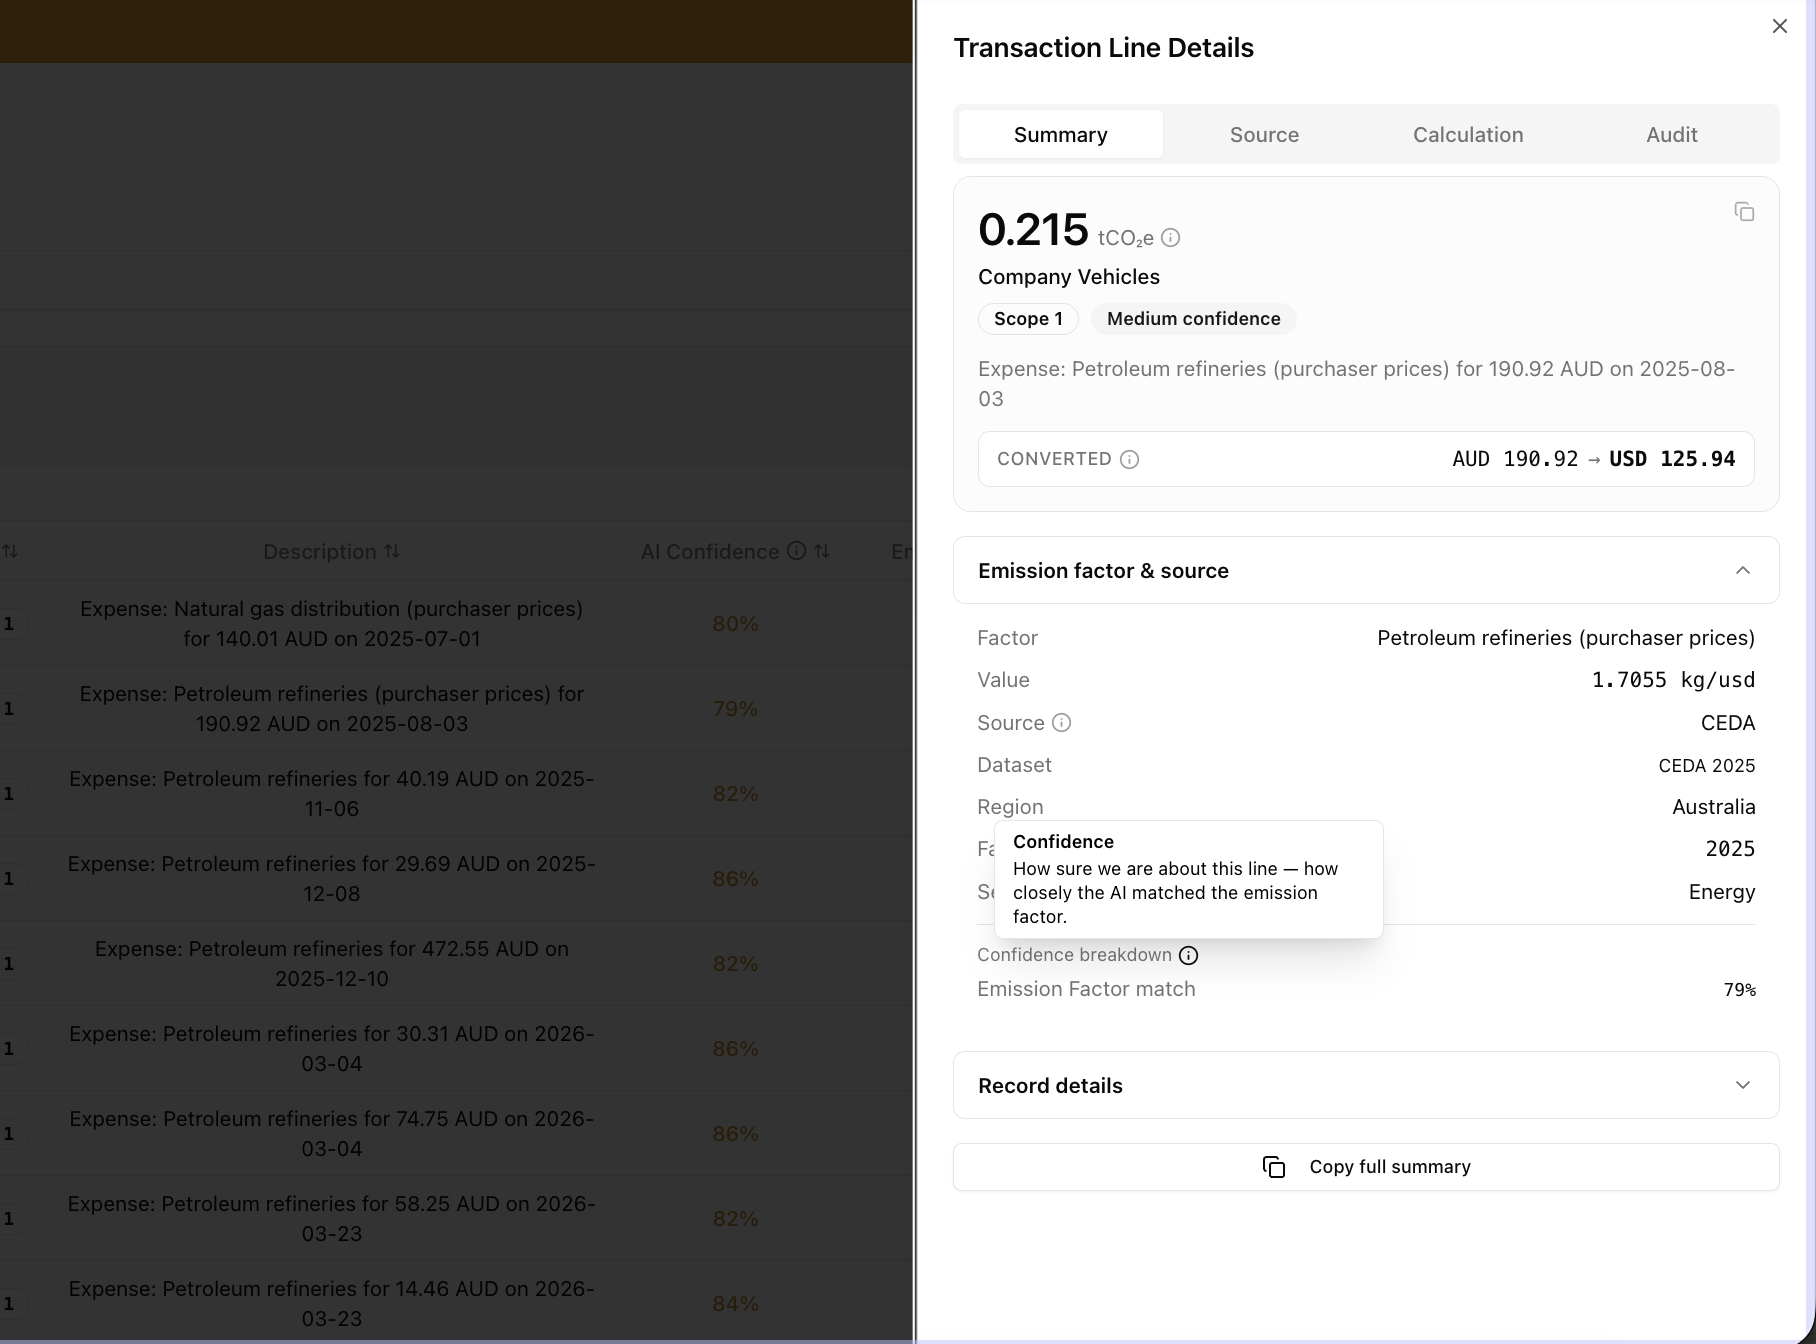
Confidence scores are also included in audit exports, so external assurers can see the same reasoning line by line without asking for it.
AI Search Filter
You don't need to know which scope or category to filter by. Type a natural-language question into the AI search bar and NetNada will set up the filters for you.
Examples:
- "Show me all electricity entries" — sets scope and category filters automatically
- "Entries without a supplier name" — filters for data quality gaps
- "Entries with no emission factor" — finds unmatched rows
- "Entries from CEDA database" — filters by emission factor source
Filtering
Beyond AI search, you can filter manually by:
- Entity / node — Select specific facilities (searchable dropdown)
- Time period — Filter by date range
- Scope — Scope 1, 2, or 3
- GHG category — Specific emissions categories
- Data source — File, invoice/bill, calculator, or modelling
- AI confidence — Filter by confidence level
- Supplier — Search by supplier name
- Data quality — Missing supplier name, missing emission factor, failed entries
- Emission factor source — Filter by database (e.g., CEDA, DEFRA, custom)
Editing Entries
Edit GHG Category
If a transaction was classified into the wrong category, you can reassign it. Select the entry, choose the correct GHG category, and provide a reason for the change.
Edit Emission Factor
Search for a different emission factor within NetNada's database by selecting the sector, category, region, source, year, unit type, scope, and lifecycle activity. NetNada pre-filters based on the entry's existing unit to show relevant options.
Bulk Editing
Apply a filter first to narrow your view, then use Select All to select all entries matching that filter. The selection count reflects only the filtered entries — for example, filtering for Scope 2 and selecting all might give you 24 entries. You can then apply changes (like a new emission factor) to all selected entries at once.
Currency Conversion and Calculation Transparency
When spend-based data is recorded in a different currency or year to its emission factor, NetNada converts the amount before applying the factor — and every conversion step is visible rather than hidden inside the calculation.
Open a transaction line to see the converted amount alongside the emission factor and its source. The Calculation tab lays out the step-by-step chain from the original activity, through the exchange-rate and inflation multipliers, to the converted activity, the emission factor and the final emissions — with the raw calculation log expandable underneath for deeper review.
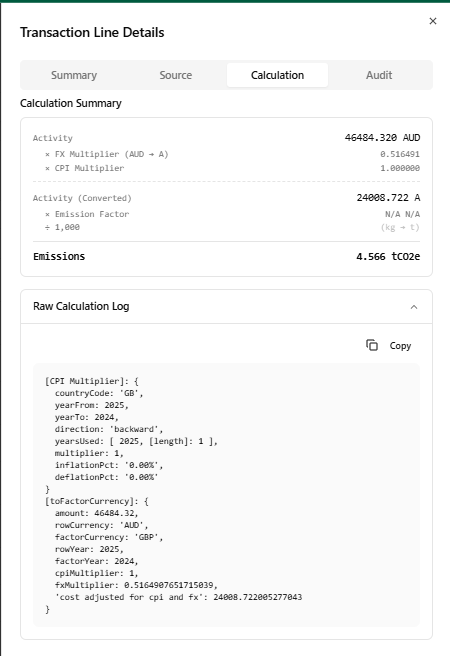
The audit export carries the same detail. The exchange-rate multiplier, the inflation multiplier and the converted activity appear as columns, the arithmetic is spelled out as a one-line equation, and a recalculation check confirms whether each row reconciles to the reported figure. Where a row genuinely cannot be re-performed — for example, where an input was never recorded — the export says so plainly rather than presenting a false mismatch.
Exporting Data
Click Download to export the current view (including any active filters) as an Excel file. The export includes all visible columns — so add the columns you need before downloading.