Impact of Inflation and Currency Exchange in Carbon Accounting: Complete Guide
The Hidden Cost of Inflation in Your Carbon Footprint (and How to Eliminate It)
We’ve all been there. You’ve spent weeks chasing down invoices and collating financial data for your company’s carbon footprint report. You finally have all your expenditure data lined up, you run it through your calculations, and the final emissions number just feels… off. It seems too high, or maybe too low, and you can’t quite put your finger on why. If this sounds familiar, you may be falling into a hidden trap in spend-based carbon accounting: the dual impact of inflation and currency conversions.
Most of the time, this isn’t about bad data; it’s about not accounting for the way money changes over time. When you’re using financial data to calculate your emissions, especially for Scope 3, you’re often working with emission factors that weren’t published this year. This creates a mismatch between your current spending and the factor’s baseline, leading to inaccurate and non-auditable carbon reporting.
But don’t worry. Getting this right isn’t as daunting as it sounds. Let’s walk through why this happens and the straightforward, two-step process to fix it.
Emission factors are not published every year
Spend-based analysis is a common method for calculating emissions from purchased goods and services. You take an expense from your company’s ledger - say, for marketing services or business travel - and multiply it by an emissions factor to get your carbon footprint.
Spend based emission factors are often expressed as kgCO2e per dollar (or euro, or yen)
However, here’s the catch: emission factors are not published every single year for every region. It’s common to use a factor published in 2019 for an expense that occurred in 2024. This is where the trouble starts. The value of money is not static; it changes due to inflation. A dollar spent in 2024 does not have the same purchasing power as a dollar from 2019. Simply multiplying your 2024 expense by the 2019 factor ignores this crucial economic reality, leading to a skewed emissions total.
So, how do you correctly align your modern spending with a historical emissions factor? You need to adjust for inflation first.
Step 1: Adjust your spend to match the year of the emission factor
The goal is to** adjust your activity (your spending) to match the year of the emission factor**. If you have a $100 expense from 2021 but are using an emissions factor from 2017, you need to find out what that $100 was worth back in 2017. This process is often called “de-inflating” your spend.
The key is to use compound inflation. You can’t just add up the inflation rates for each year; you have to multiply them to see the cumulative effect.
Let’s look at a real-world example:
- Your Spend: $100 AUD in 2021
- Your Emission Factor Year: 2017
To find the 2017 value of that $100, you need to divide it by the compound inflation of the years in between (2018, 2019, 2020, and 2021). Let’s assume the following inflation rates:
- 2018: 2% (Multiplier: 1.02)
- 2019: 5% (Multiplier: 1.05)
- 2020: 2% (Multiplier: 1.02)
- 2021: 2% (Multiplier: 1.02)
The calculation would be:
$100 / (1.02 * 1.05 * 1.02 * 1.02) = $89.74
This tells you that the $100 spent in 2021 had the purchasing power of roughly $89.74 back in 2017. This is the inflation-adjusted number you should use for your emissions calculation. You always adjust the spend amount, not the emissions factor itself.
Step 2: Adjust Currency Conversion
Inflation isn’t the only hurdle. What happens when your expense is in Australian Dollars (AUD), but your only available emissions factor is in Euros (EUR)? You can’t just use today’s exchange rate. You must use the
historical exchange rate from the emission factor’s year.
The most reliable way to do this is with a two-step conversion process, often using a major currency like the US Dollar (USD) as a bridge.
Let’s say you have an inflation-adjusted spend of $100 AUD from 2019, and you need to convert it to EUR for a 2019 emissions factor.
Hypothetical 2019 Exchange Rates:
- 1 AUD = 0.70 USD
- 1 EUR = 1.12 USD
First, convert your AUD to the bridge currency (USD):
100 AUD * 0.70 = 70.00 USD
Next, convert the USD amount to your target currency (EUR):
70.00 USD / 1.12 = 62.50 EUR
So, your $100 AUD spend is equivalent to €62.50 in the context of the 2019 emission factor. You can now confidently multiply this final amount by your emissions factor.
Let’s run through a full example:
To get an accurate, auditable result, you must perform these adjustments in the correct order.
-
Adjust for Inflation First: Take your original spend and adjust it back to the emission factor’s year, while keeping it in the original currency.
-
Convert Currency Second: Use the inflation-adjusted amount to perform the currency conversion using the historical exchange rates from the emission factor’s year.
-
Initial Spend: $100 AUD in 2021
-
Emission Factor: From 2019, in kgCO2e/EUR
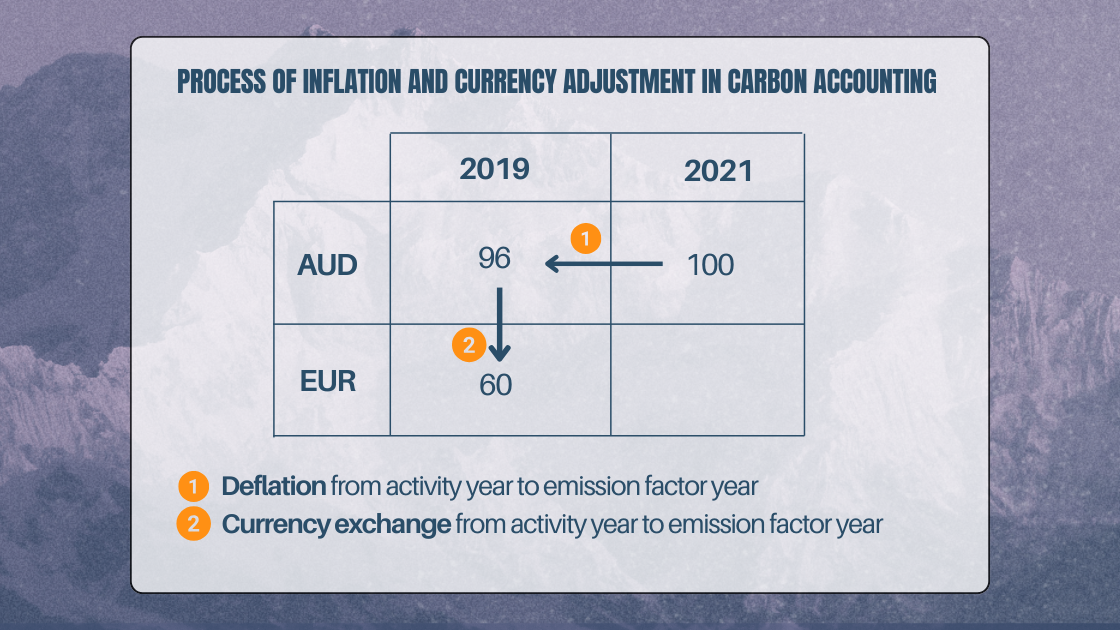 Process of inflation and currency adjustmentStep 1 (Inflation): First, we adjust the $100 AUD from 2021 back to its 2019 value. Let’s say after accounting for inflation in 2020 and 2021, the adjusted value is $96.12 AUD.
Step 2 (Currency): Now, we convert this inflation-adjusted $96.12 AUD to EUR using 2019 exchange rates.
- 96.12 AUD * 0.70 (AUD to USD) = 67.28 USD
- 67.28 USD / 1.12 (EUR to USD) = 60.07 EUR
Your final, fully-adjusted spend is
€60.07. This is the number you should multiply by your 2019 emissions factor. By following these steps, you’ve successfully corrected for both time and geography, creating a far more accurate picture of your carbon footprint.
Why This Matters for You and your Carbon Inventory
As sustainability managers, our goal is to produce reports that are not only comprehensive but credible. Failing to account for inflation and currency fluctuations can undermine the integrity of your entire GHG inventory. It can lead to over- or under-reporting emissions, making it difficult to track progress, set meaningful targets, and ensure your data is auditable.
How NetNada can help
NetNada carbon accounting software automatically detects the year of your spending in the currency and adjusts both for inflation as well as for currency conversions at any given point across primary economic regions. By doing so this ensures that you have access to auditable data from reliable sources as well as making your data auditable replicable and accurate.
All you have to do is submit a try balance, a general ledger, or your company journals, and our system will detect the correct emission factor to apply, the differences between publication of the emission factor and your expense, and any necessary currency conversions that need to be done.
By understanding and applying these adjustments, you move from a preliminary estimate to a robust, auditable calculation that can be audited as part of mandatory climate reporting like AASB S2.
You build trust with stakeholders and ensure that your sustainability strategy is built on a foundation of accurate data. The best practice will always be to use the most recent emissions factor available, but when that’s not possible, this methodology is the missing link to accurate carbon accounting.
Frequently Asked Questions (FAQ)
🤔 Why is my carbon footprint inaccurate? Your carbon footprint can be inaccurate if you use a historical emissions factor with current financial data without adjusting for inflation. A dollar in 2024 doesn’t buy the same amount as a dollar in 2019, and this change in purchasing power needs to be accounted for to get a true reading.
🛠️ How do I fix inflation in my carbon reporting? The correct method is to adjust your
spend data, not the emissions factor. You “de-inflate” the expense to match the value of money in the year the factor was published. This is done by dividing your spend amount by the compound inflation rate between the year of the expense and the year of the factor.
💡 What is the best way to convert expenditure to carbon emissions? The ideal method is to use an emissions factor from the same year as your expenditure. When that’s not possible, the most accurate approach is a two-step process: 1) adjust your spending data for inflation to match the factor’s year , and 2) convert the currency of that adjusted amount using the historical exchange rates from the factor’s year.
🌍 How do exchange rates affect my Scope 3 emissions? Exchange rates are critical when your expense currency (e.g., AUD) is different from your factor’s currency (e.g., EUR). Using a current exchange rate instead of the historical rate from the factor’s publication year will distort your calculations and lead to inaccurate Scope 3 reporting.
✅ Is my carbon data auditable? For your data to be auditable, your methodology must be transparent, consistent, and accurate. Properly adjusting for inflation and using correct historical currency exchange rates are essential for creating a defensible and verifiable carbon inventory. Without these steps, your data may not stand up to third-party scrutiny.
Start Your Climate Reporting Journey
Join 1,000+ Australian businesses using NetNada for carbon accounting and sustainability reporting.