NetNada - February 2026 Product Release


This sprint delivers meaningful improvements across Instant Reporting, Nettie AI, Waste analytics, and Emissions Projections & Targets. The theme is simple: make sustainability insights faster to access, easier to interpret, and more reliable in your day-to-day workflow.
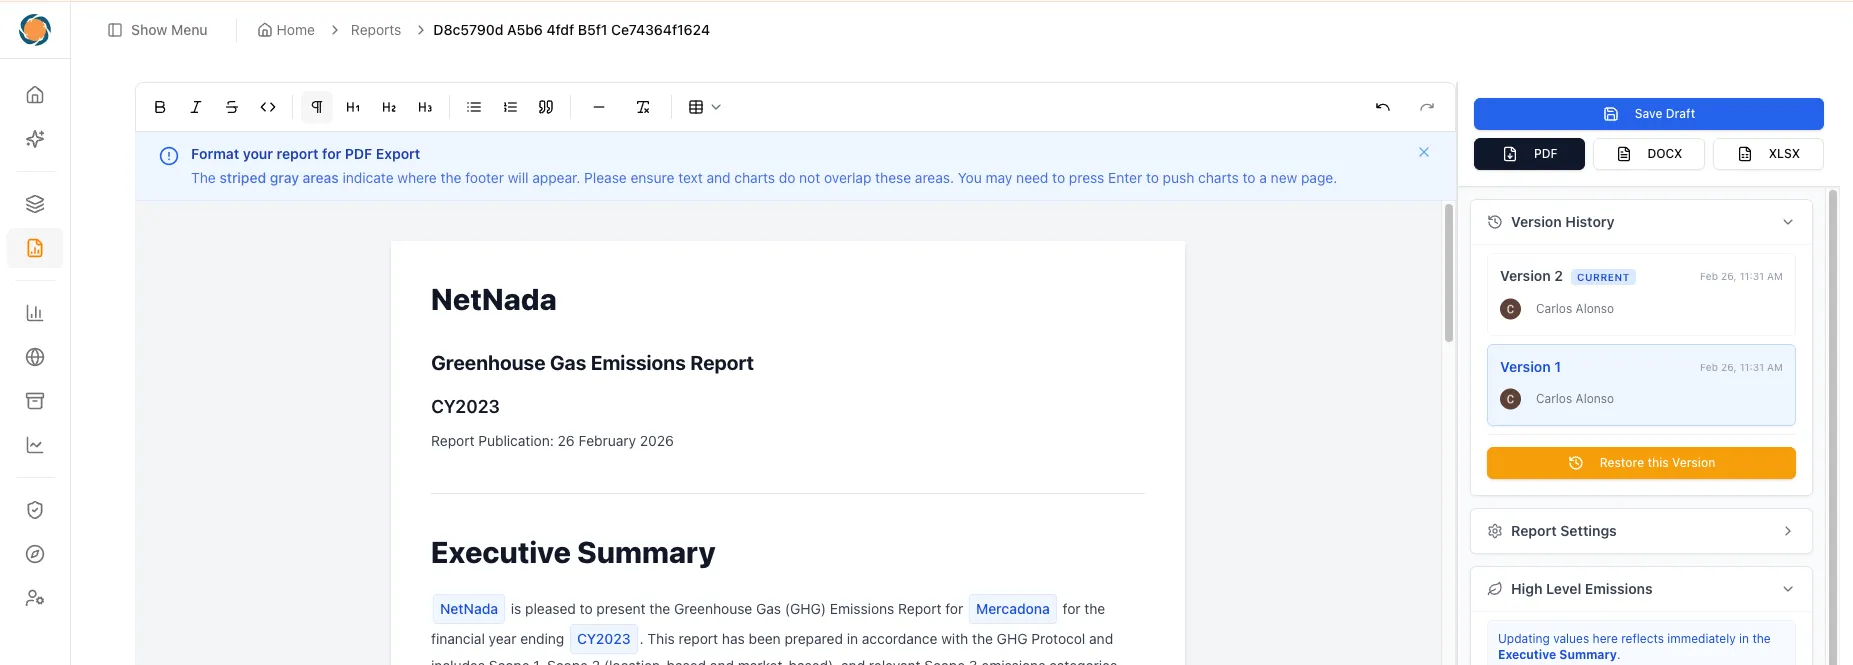
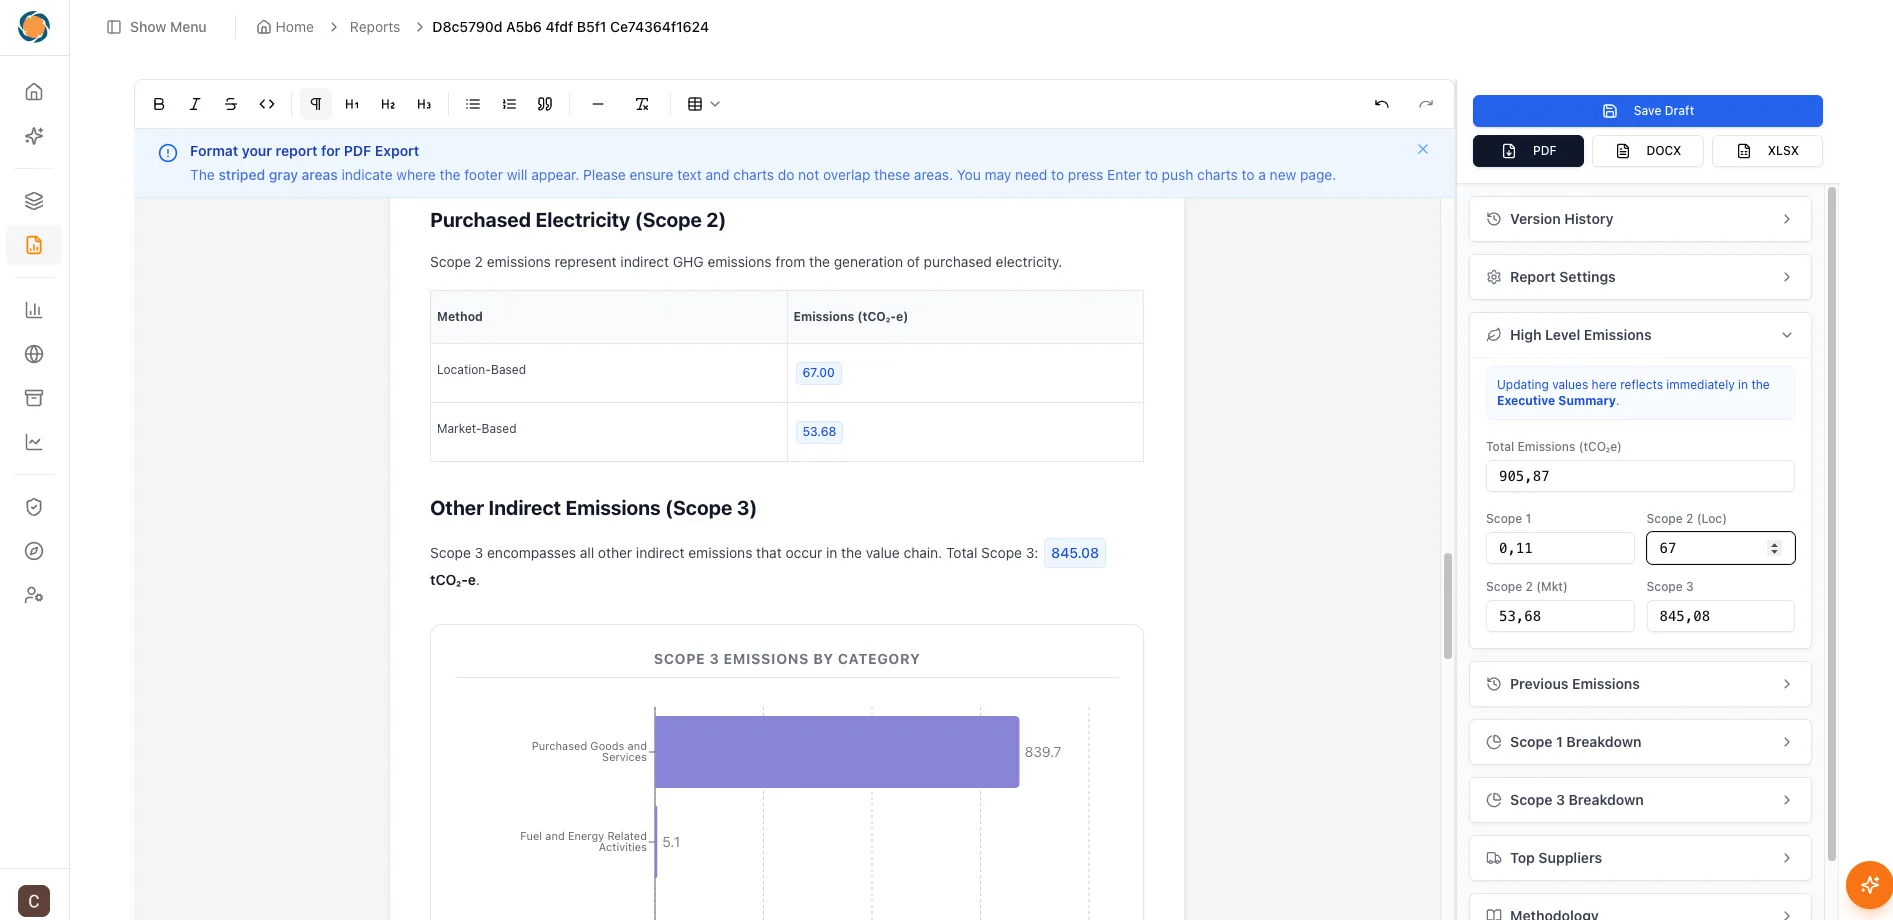
Instant Reporting — Now Fully Self-Serve
This is the big one. You can now generate beautifully formatted sustainability reports directly from the Report section in the sidebar. No manual workarounds. No external formatting. Just click, customise, and export.
If you’ve ever spent days pulling together a carbon report across spreadsheets, slide decks, and email threads, you know the pain. Mandatory climate disclosure under frameworks like AASB S2 and NGER demands accurate, audit-ready reports — and the formatting alone can eat hours. With Instant Reporting, that entire process collapses into minutes. Your data is already in NetNada. Now your reports are too.
What you can generate:
- Full Carbon Report — comprehensive breakdown of your entire carbon footprint
- Carbon Executive Summary — high-level snapshot for leadership and board presentations
- Waste Report — detailed metrics including weight (kg), volume, and total emissions
Pro tips to get the most out of Reports:
- Flexible timeframes — run reports for full periods or custom date ranges
- The Controller — update repeated variables in one place from the right sidebar
- Export your way — download as Spreadsheet, PDF, or DOCX
- Save as you go — progress is preserved automatically
- Version history — easily review or revert to previous versions

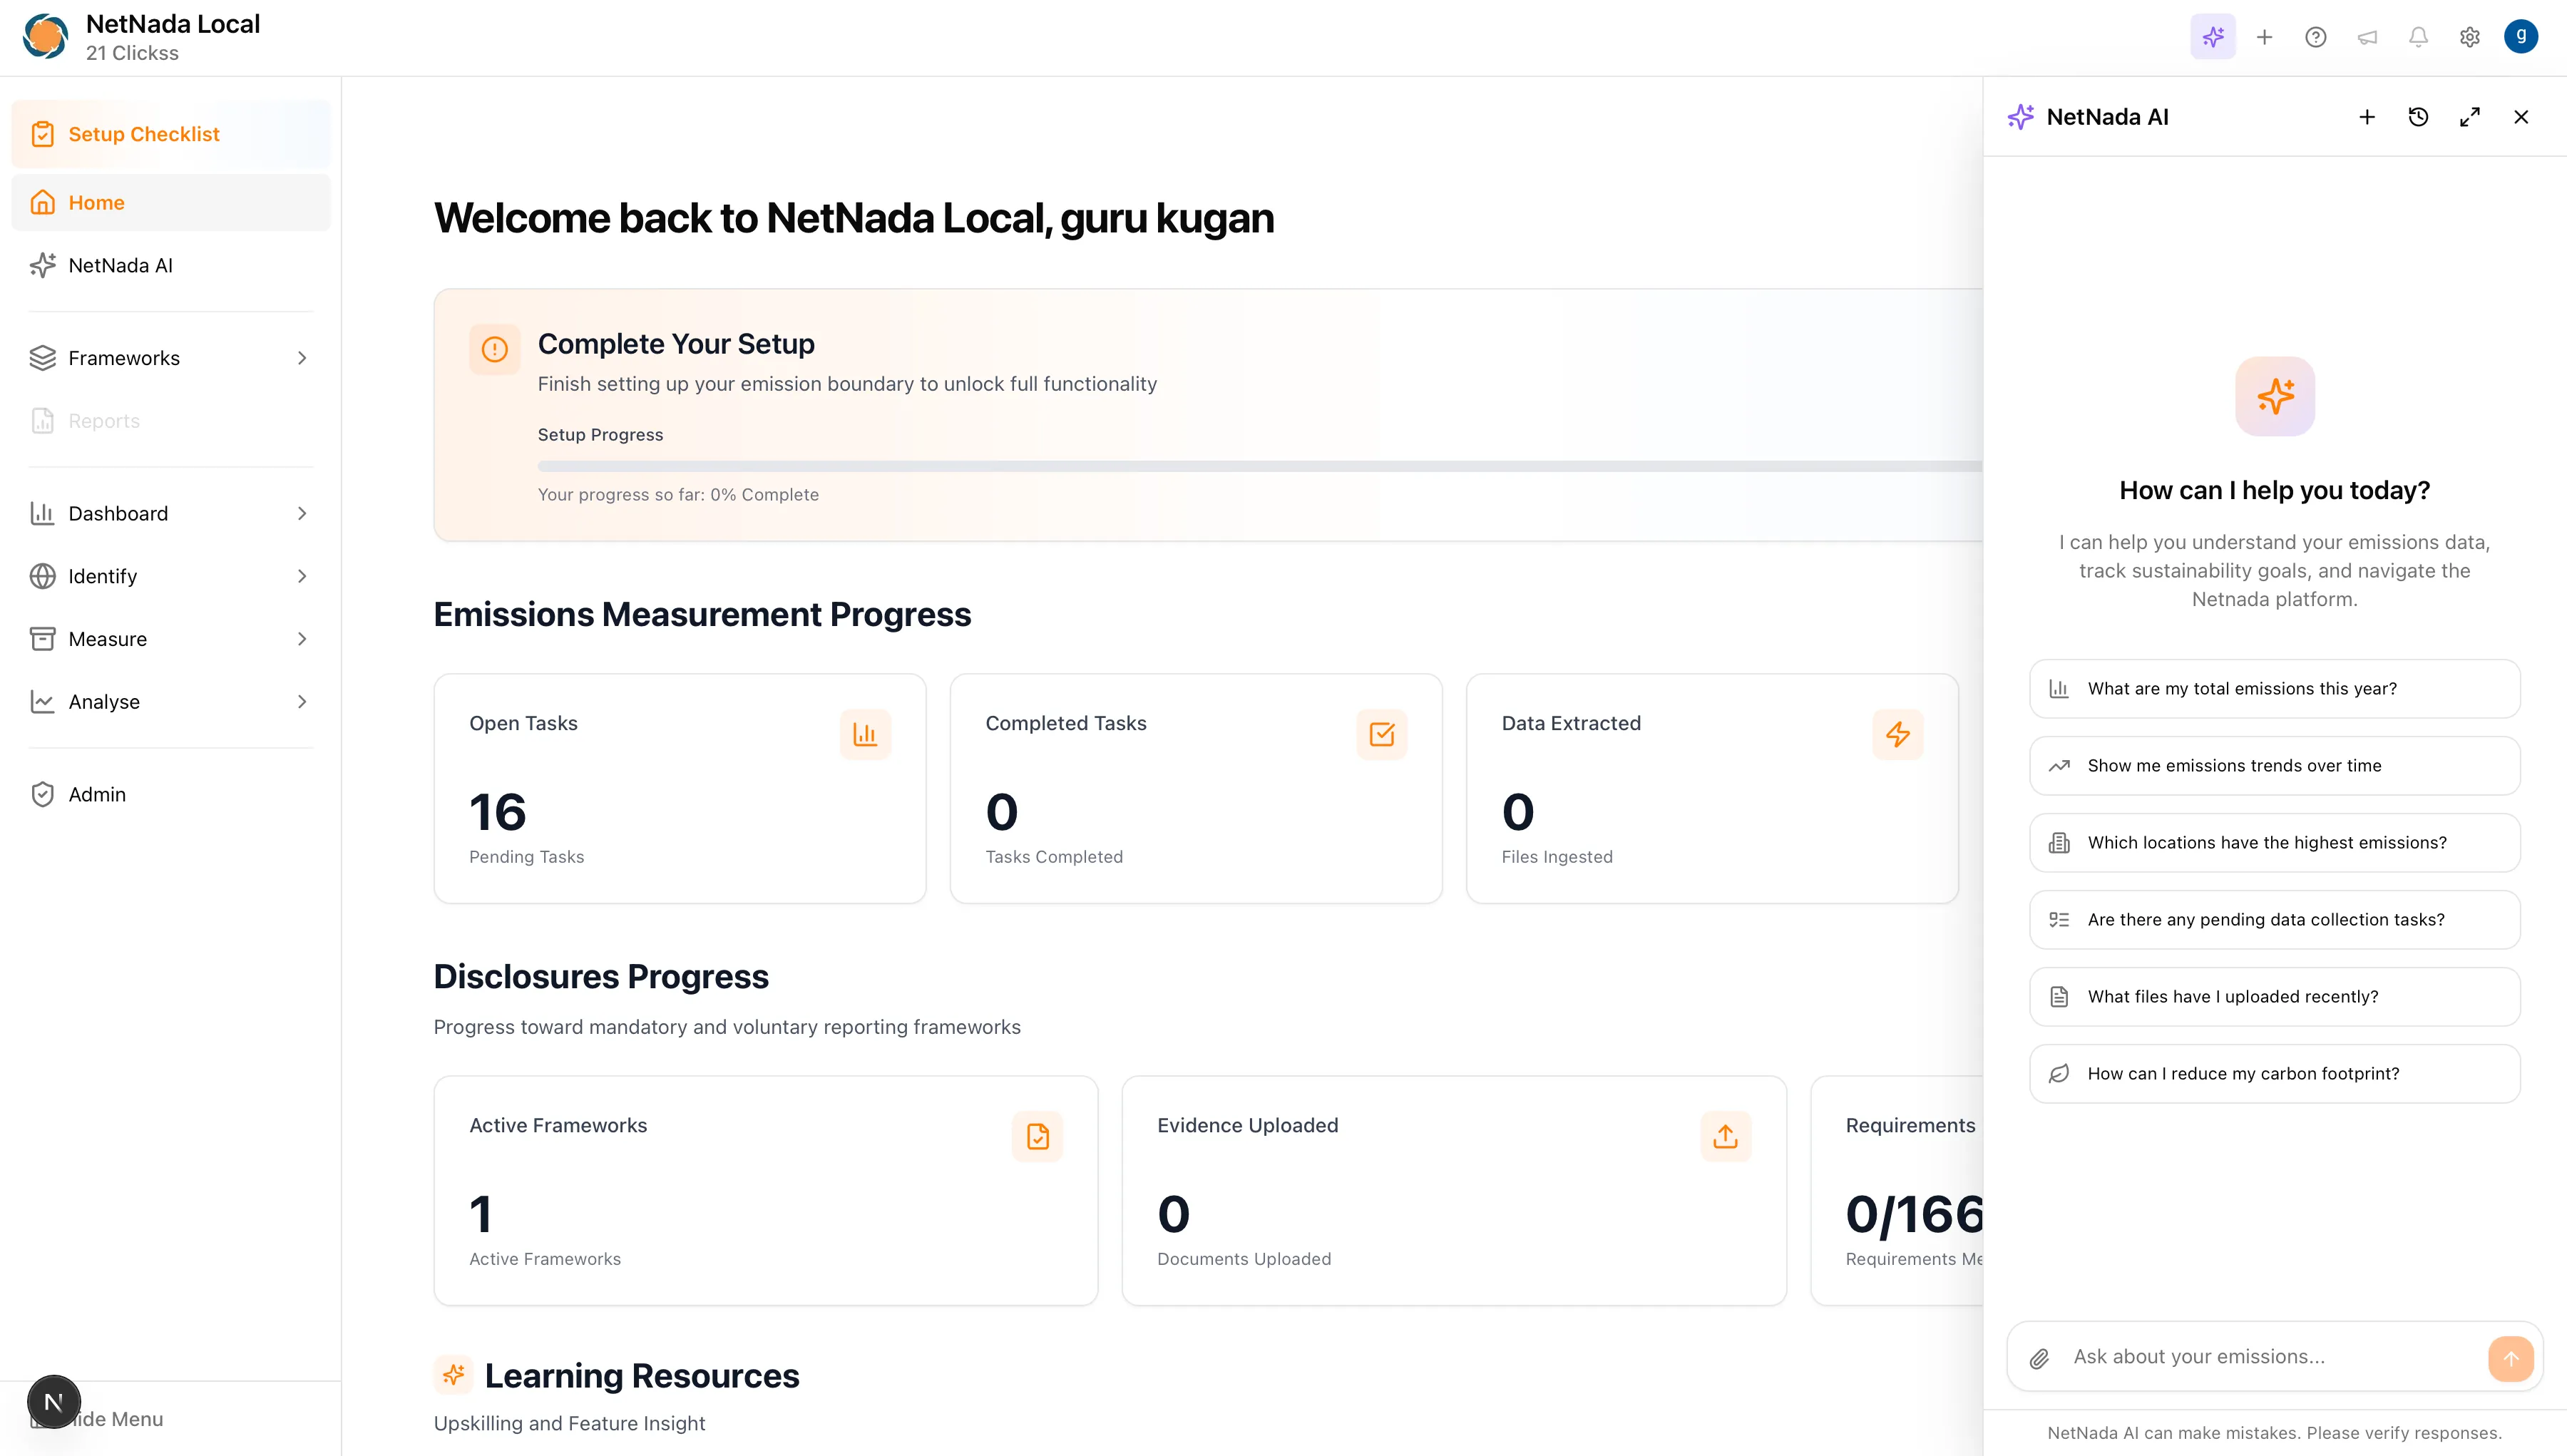
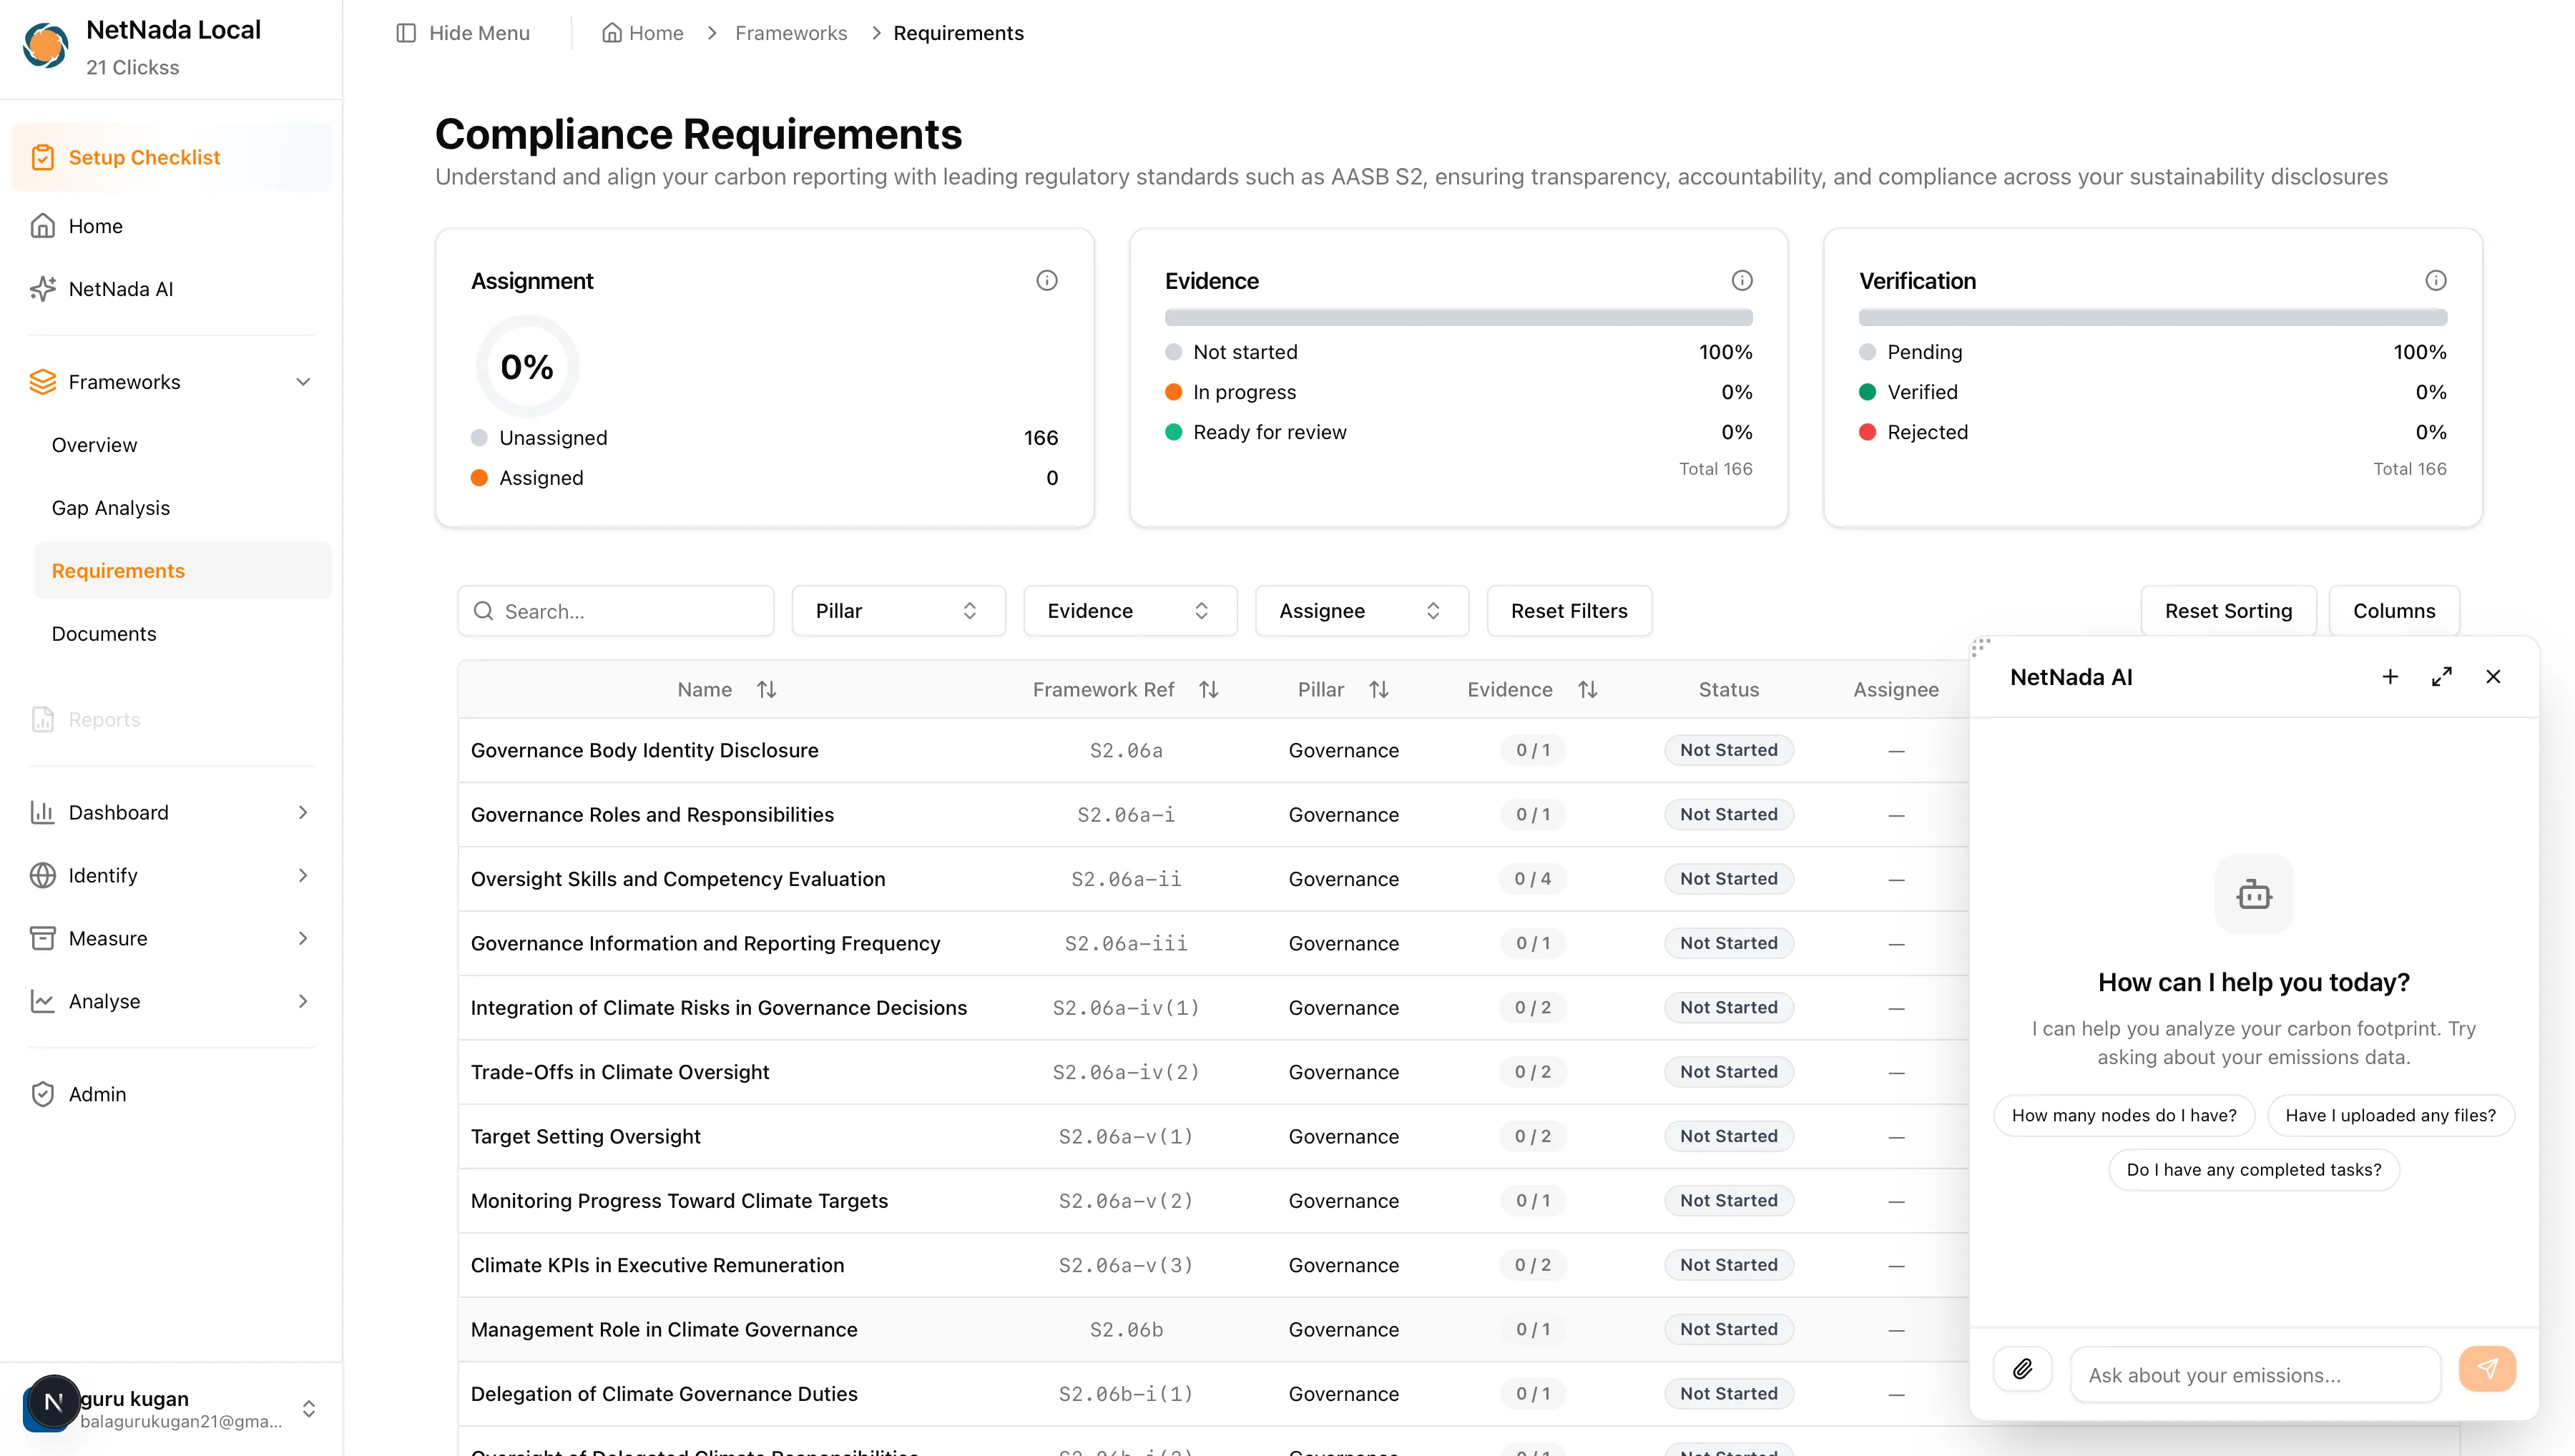
Nettie AI — Context-Aware Across the Platform
Nettie has completed Phase 1 of its context-aware rollout. It’s now available everywhere in the platform, laying the foundation for deeper intelligence ahead.
Sustainability teams juggle a huge amount of context — emissions data, compliance requirements, supplier responses, framework deadlines. The problem isn’t just finding information, it’s finding the right information at the right time. Nettie now understands where you are in the platform and adapts its responses accordingly. Reviewing AASB S2 governance requirements? Nettie knows, and surfaces relevant guidance without you having to explain the context. It’s like having a sustainability analyst that’s always up to speed.
What’s new:
- Use Nettie as a floating chat widget or sidebar — your choice
- Context updates automatically as you navigate, keeping Nettie situationally aware
- Structured responses now render clean table views for easier analysis and sharing
- Improved availability and responsiveness across the product
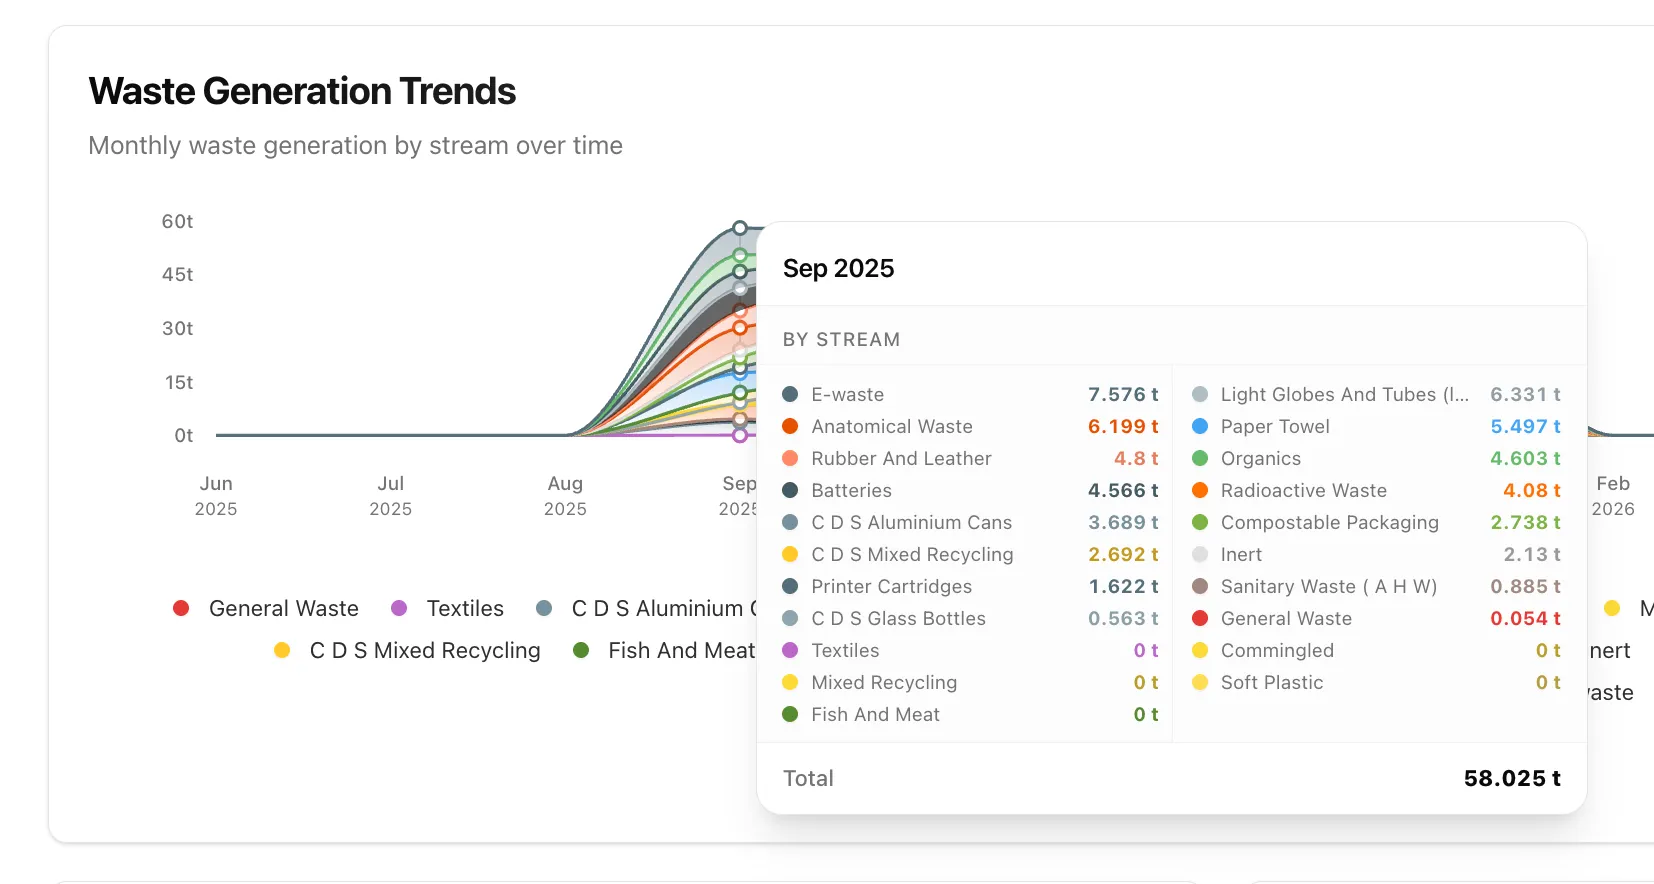
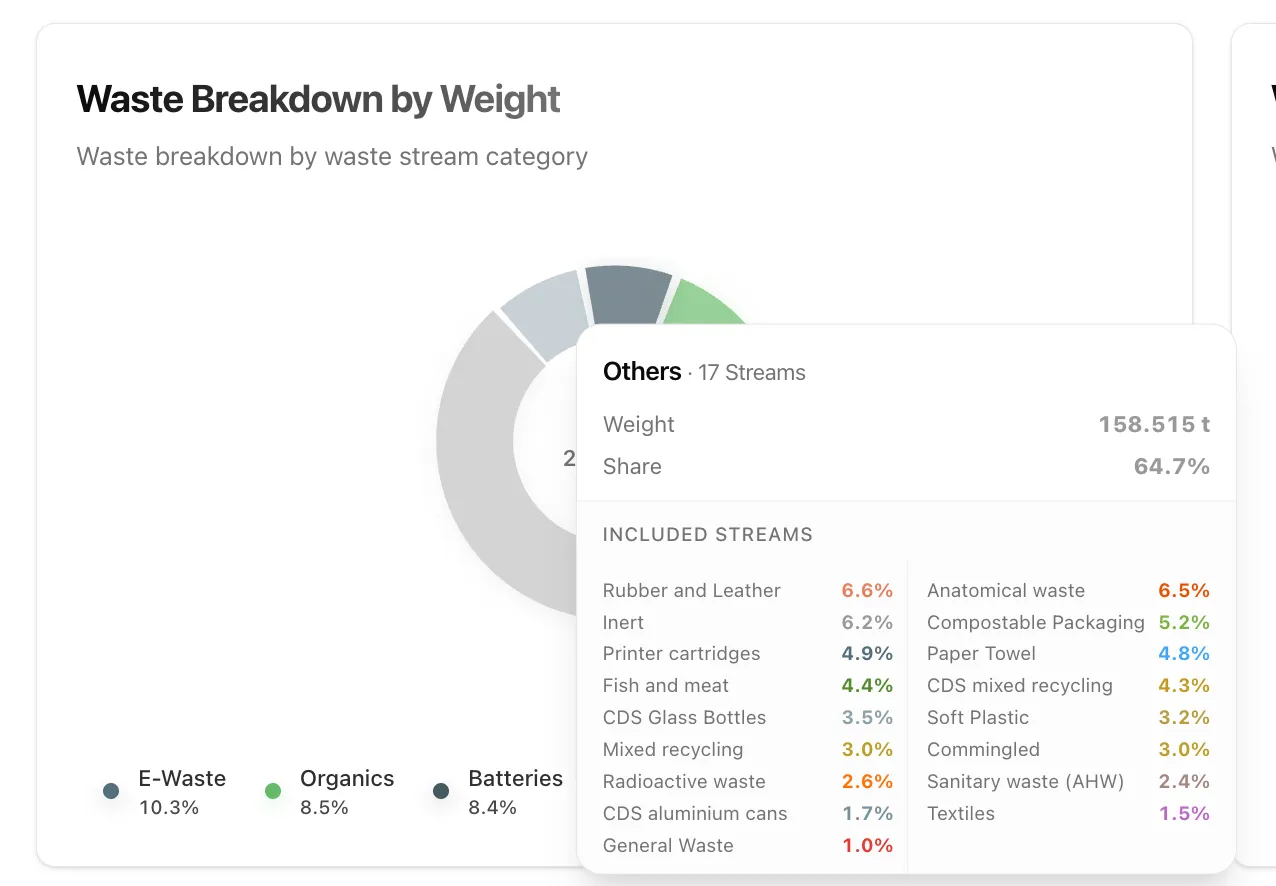
Waste Analytics & Dashboard Improvements
Waste insights have been refined for better analytical clarity and fewer edge-case inconsistencies.
Waste reporting is one of the trickiest areas in sustainability. Organisations often deal with dozens of waste streams, inconsistent data from waste haulers, and missing density values that make volume-to-weight conversions unreliable. When your diversion rate calculation is wrong, your entire waste strategy can be built on flawed assumptions. These improvements ensure that what you see on the dashboard is accurate and trustworthy — whether you’re reporting to NABERS, Climate Active, or your own board.
Key improvements:
- Optimised graph tooltips — clearer interpretation when many waste streams are present
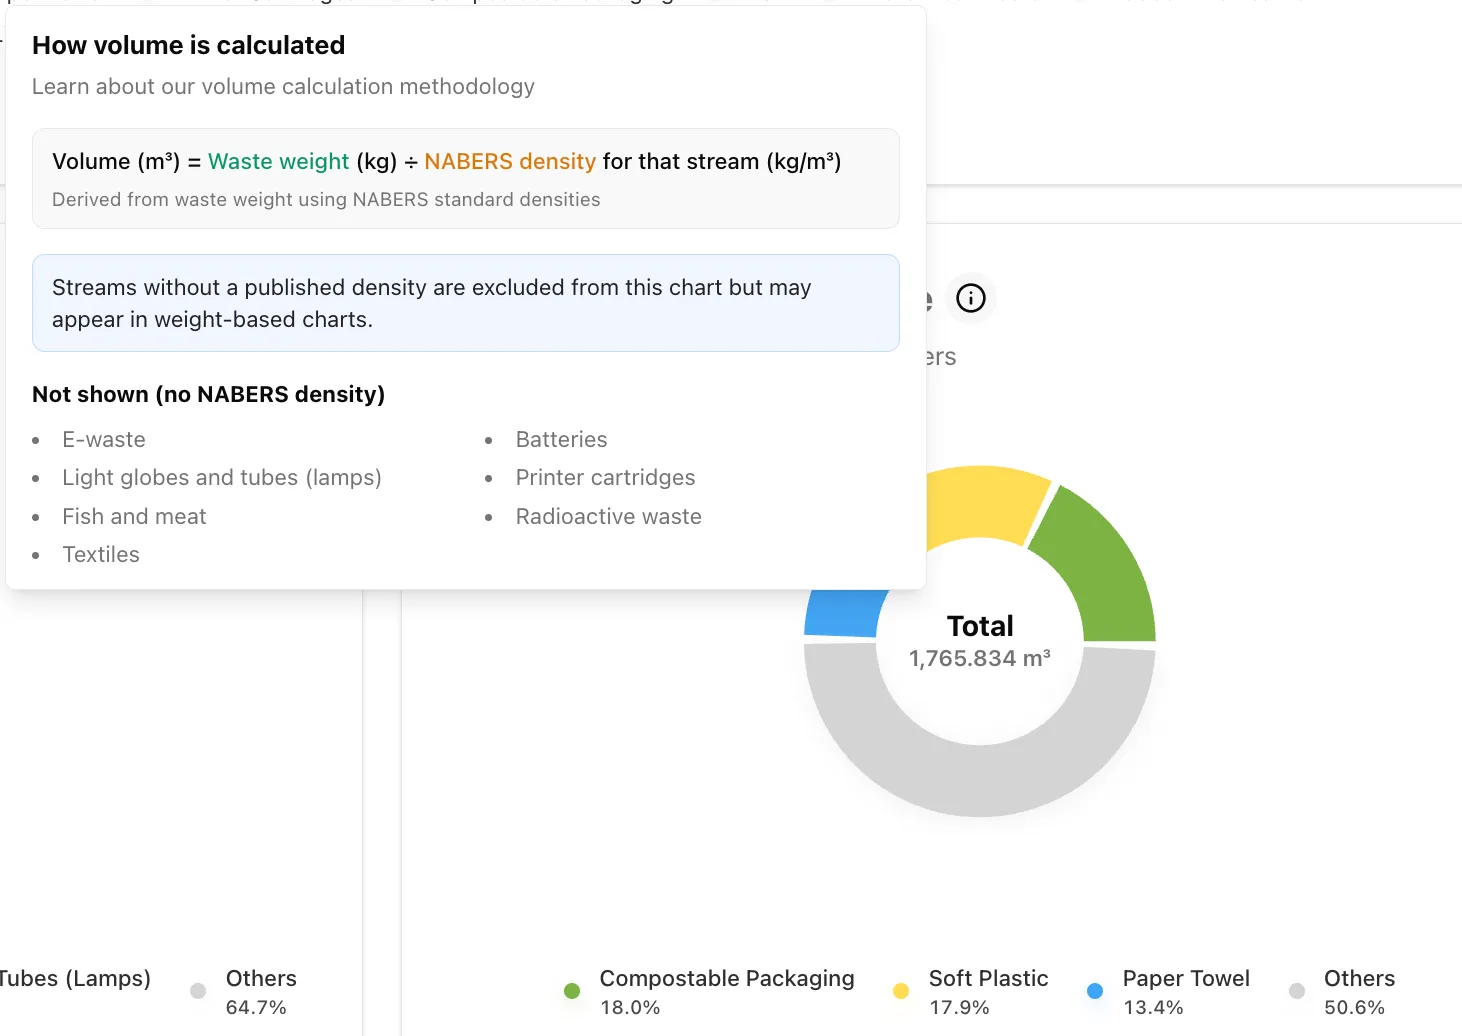
- Improved volume visibility — better identification of streams with missing density values
- Dashboard consistency fixes — resolved inconsistencies across graphs and filters
- Diversion rate corrections — calculations now behave correctly when municipal waste is present
- Expanded waste template — new waste types added to the activity template
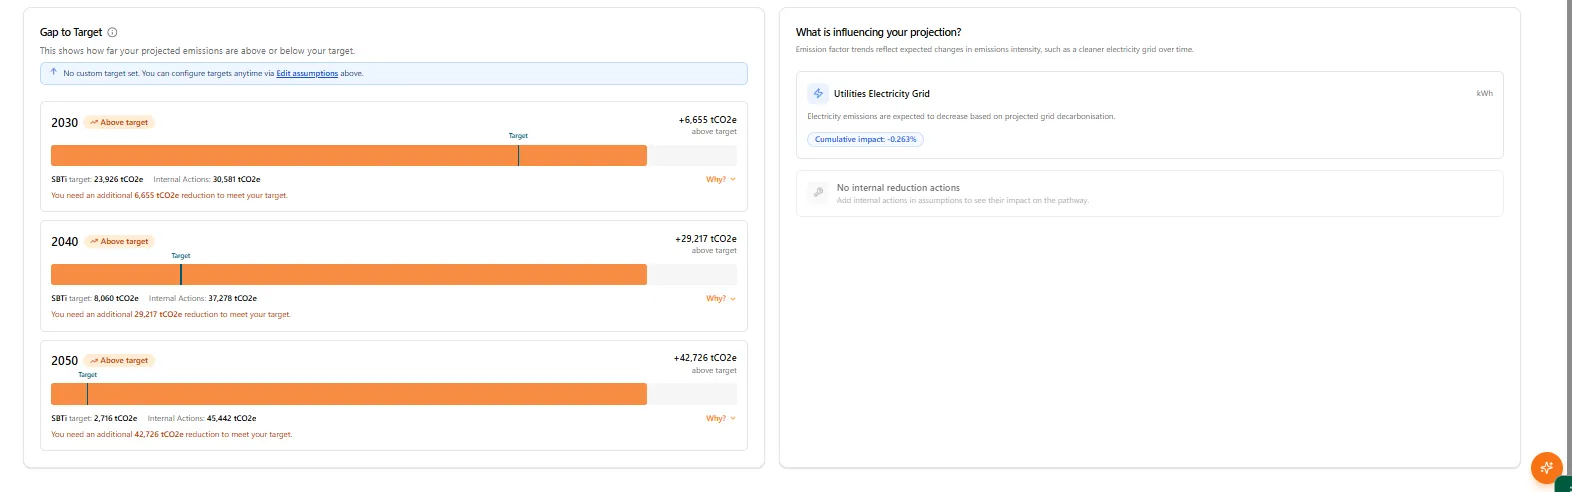
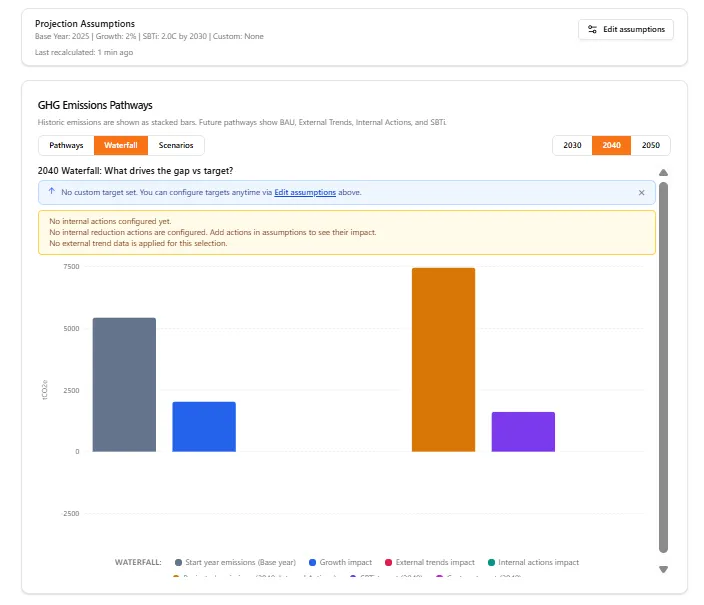
Emissions Projections & Targets (Phase 2)
The modelling journey is now more guided, more intuitive, and more decision-ready.
Setting science-based targets is one thing. Understanding whether you’re actually on track to meet them is another. Most organisations set an SBTi target and then check back a year later hoping the numbers moved in the right direction. That’s not a strategy — it’s a guess. With improved projections and targets, you can see exactly where you stand against your 2030, 2040, and 2050 goals, understand what’s driving the gap, and model the impact of internal reduction actions before committing resources. It turns target-setting from a compliance checkbox into a genuine planning tool.
What’s improved:
- Step-by-step guidance — no more guessing what to do next
- Clearer in-product explanations that feel guided rather than self-navigated
- More intuitive flow — less back-and-forth, less friction
- Better information presentation — supporting faster, more confident decisions on emissions reduction targets
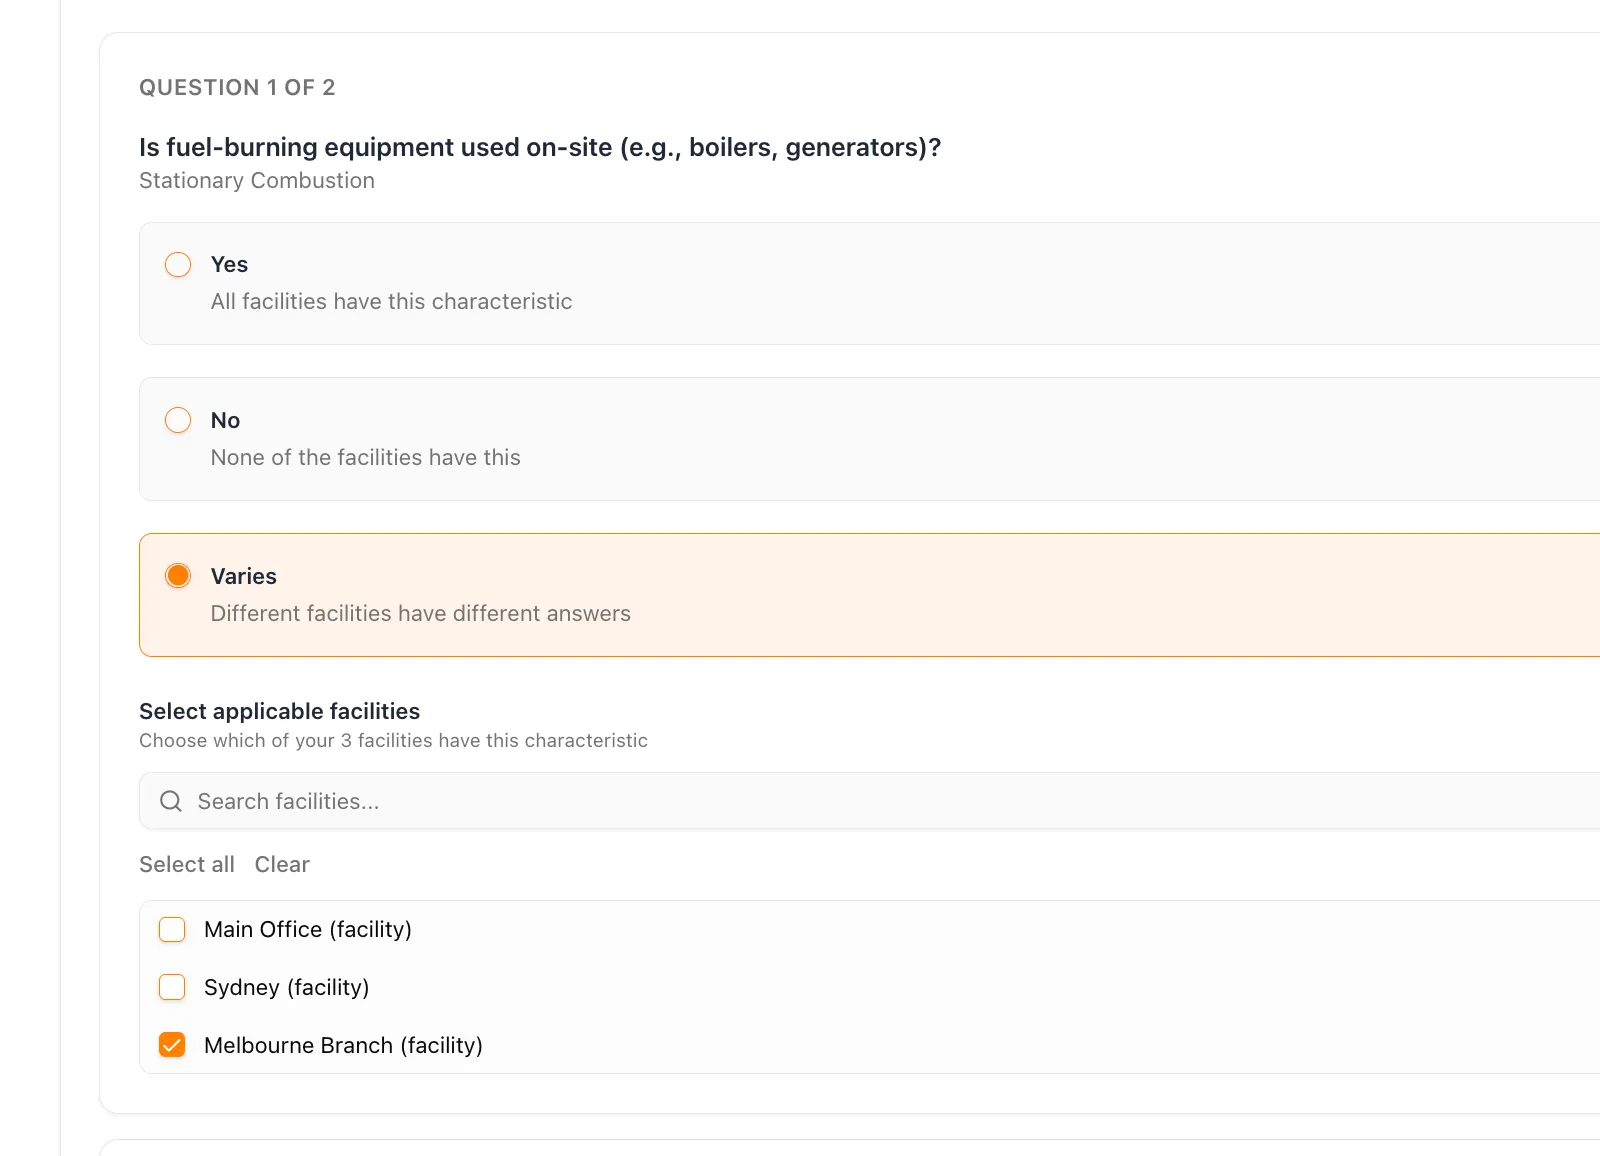
Emission Boundary & Platform Usability
This sprint also focused on reducing manual effort and smoothing key operational workflows.
Getting your emission boundary right is foundational to accurate carbon accounting. If your organisational structure doesn’t reflect reality — which facilities are in scope, which combustion sources apply where — every number downstream is compromised. The revamped interface with select-all capability makes it significantly faster to configure boundaries across multi-site organisations, especially during initial onboarding or when your corporate structure changes.
- Revamped emission boundary interface with select-all nodes capability
- Improved file deletion handling to prevent downstream inconsistencies
- File uploader progress aligned with the primary colour system
- Node ingestion enhanced with Node Reference support
- Lambda ping optimisation on invoice selection
- Support meeting link updated across the platform
Making this planet better, one sprint at a time.
Want to see these features in action? Book a demo today.
Start Your Climate Reporting Journey
Join 1,000+ Australian businesses using NetNada for carbon accounting and sustainability reporting.