NetNada - April 2026 Product Release


A better way to navigate your data, track renewables, and understand your waste.
This sprint focused on making the platform feel more intuitive and connected. We rebuilt how you select nodes across every screen, added a brand new Renewable Energy dashboard, made waste tracking significantly more transparent, and squashed several bugs that were causing friction during data uploads.
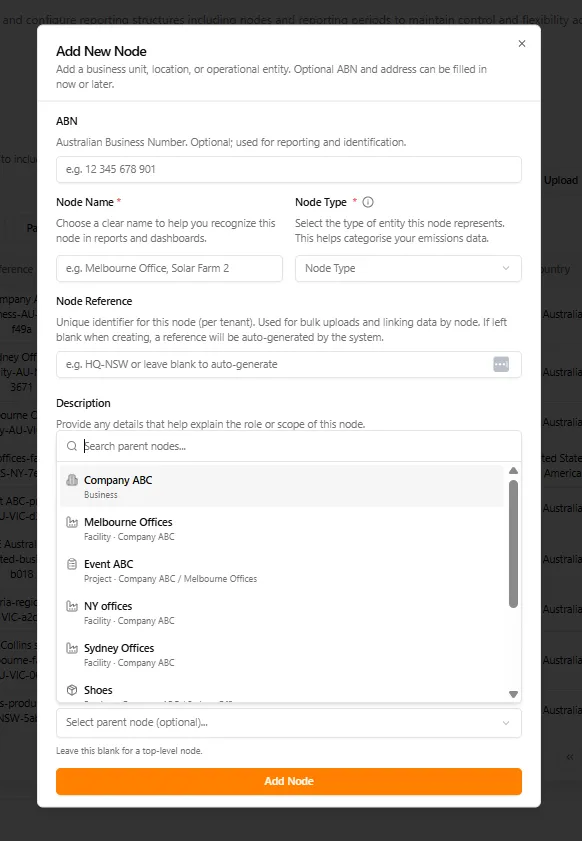
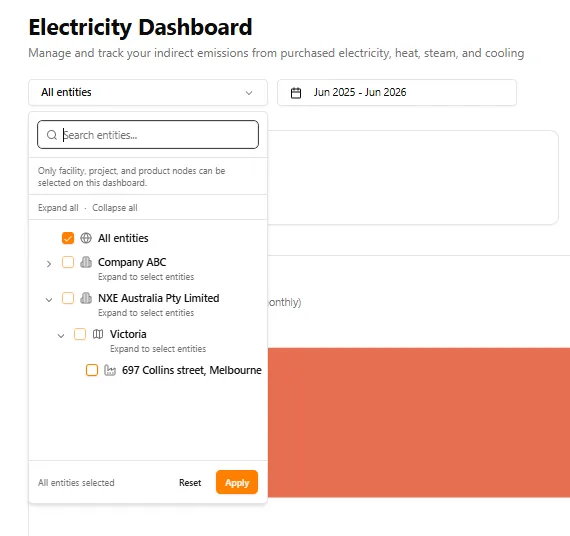
Smarter Node Selection Across the Platform
We replaced long plain dropdowns with a new searchable node selector that shows hierarchy and path context. Whether you are adding a new node, setting up a solar system, or filtering a dashboard, the experience is now consistent. Labels and empty states have been cleaned up so the wording matches the action you are performing.
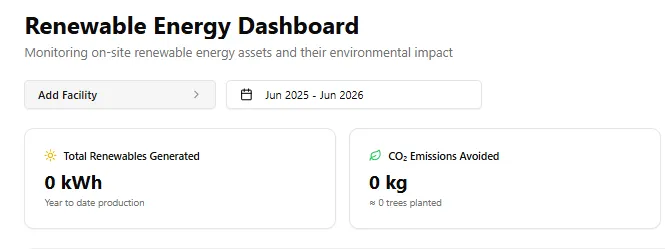
Renewable Energy Dashboard
A brand new dashboard for monitoring on-site renewable energy assets and their environmental impact. Track total renewables generated in kWh, CO₂ emissions avoided, and even see the equivalent in trees planted. You can filter by facility and reporting period to get a clear picture of your green energy contribution.
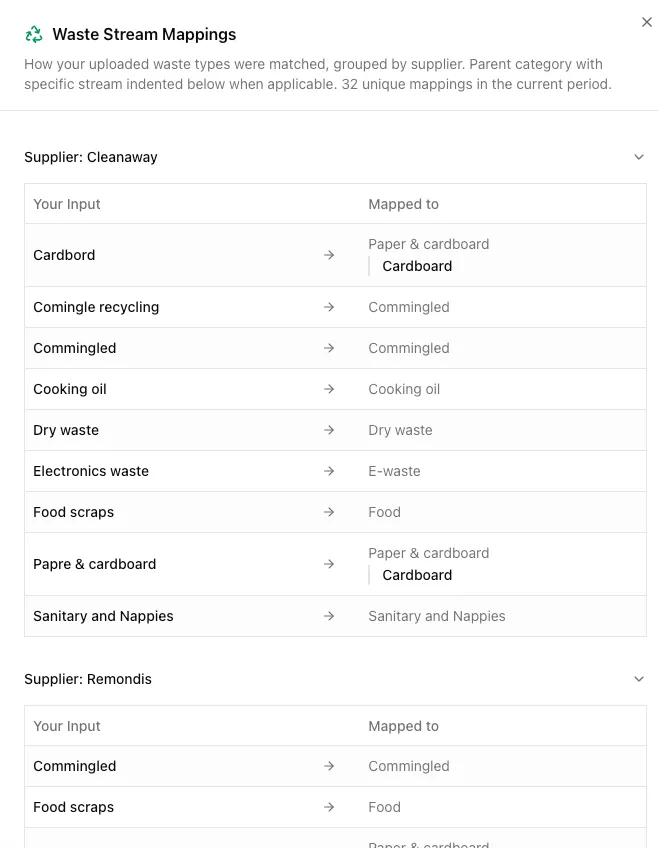
Waste Tracking Gets More Transparent
Three meaningful improvements to how you understand your waste data.
First, waste stream mappings now show supplier details so you can see exactly how your uploaded waste types were matched, grouped by each supplier.
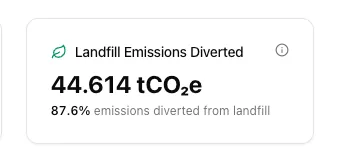
Second, a new Landfill Emissions Diverted card shows the total tCO₂e diverted along with a diversion percentage.
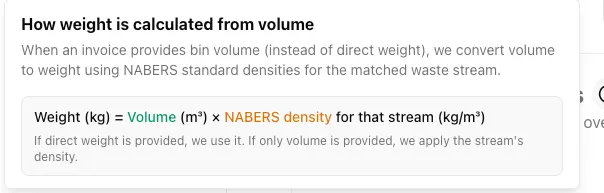
Third, we now clearly explain how weight is calculated from volume data using NABERS standard densities, so the numbers always make sense.
Clearer File Upload Error Messages
When a file upload has issues, the platform now shows you exactly what went wrong. The error detail view lists every affected row, the field with the problem, the value that caused it, and a plain language explanation of the issue. No more guessing why an upload failed.
Under the Hood
We also fixed several issues that were causing friction:
- GHG Dashboard date filter now aligns correctly with your reporting period
- Smart upload issues have been resolved and the feature is working as expected
- Column mapper warning text now matches the field that is actually selected
Making this planet better, one sprint at a time.
Want to see these features in action? Book a demo today.
Start Your Climate Reporting Journey
Join 1,000+ Australian businesses using NetNada for carbon accounting and sustainability reporting.