Supply Chain Analysis Dashboard
Know exactly where your supply chain emissions come from. NetNada's Supply Chain Analysis dashboard ranks suppliers by carbon impact, helping you identify the 10% of vendors likely responsible for 80% of your Scope 3 emissions—and prioritise engagement where it matters most.
How It Works
The Supply Chain Analysis dashboard transforms your spend and procurement data into actionable supplier emissions intelligence. Understand vendor impact, prioritise engagement, and transition from industry averages to primary supplier data over time.
Aggregate Supplier Data
The dashboard automatically aggregates transactions by supplier from your uploaded data and accounting integrations. Each vendor's purchases are totalled to show their share of your procurement activity.
Calculate Supplier Emissions
Using spend-based emission factors initially, the system calculates estimated emissions for each supplier. Suppliers are categorised by industry sector (Energy, Food Production, Buildings, etc.) for appropriate factor application.
Rank by Carbon Impact
Suppliers are automatically ranked by total emissions and percentage of your Scope 3 total. The 80/20 rule typically applies—a small number of suppliers represent most of your supply chain carbon footprint.
Drill Into Transactions
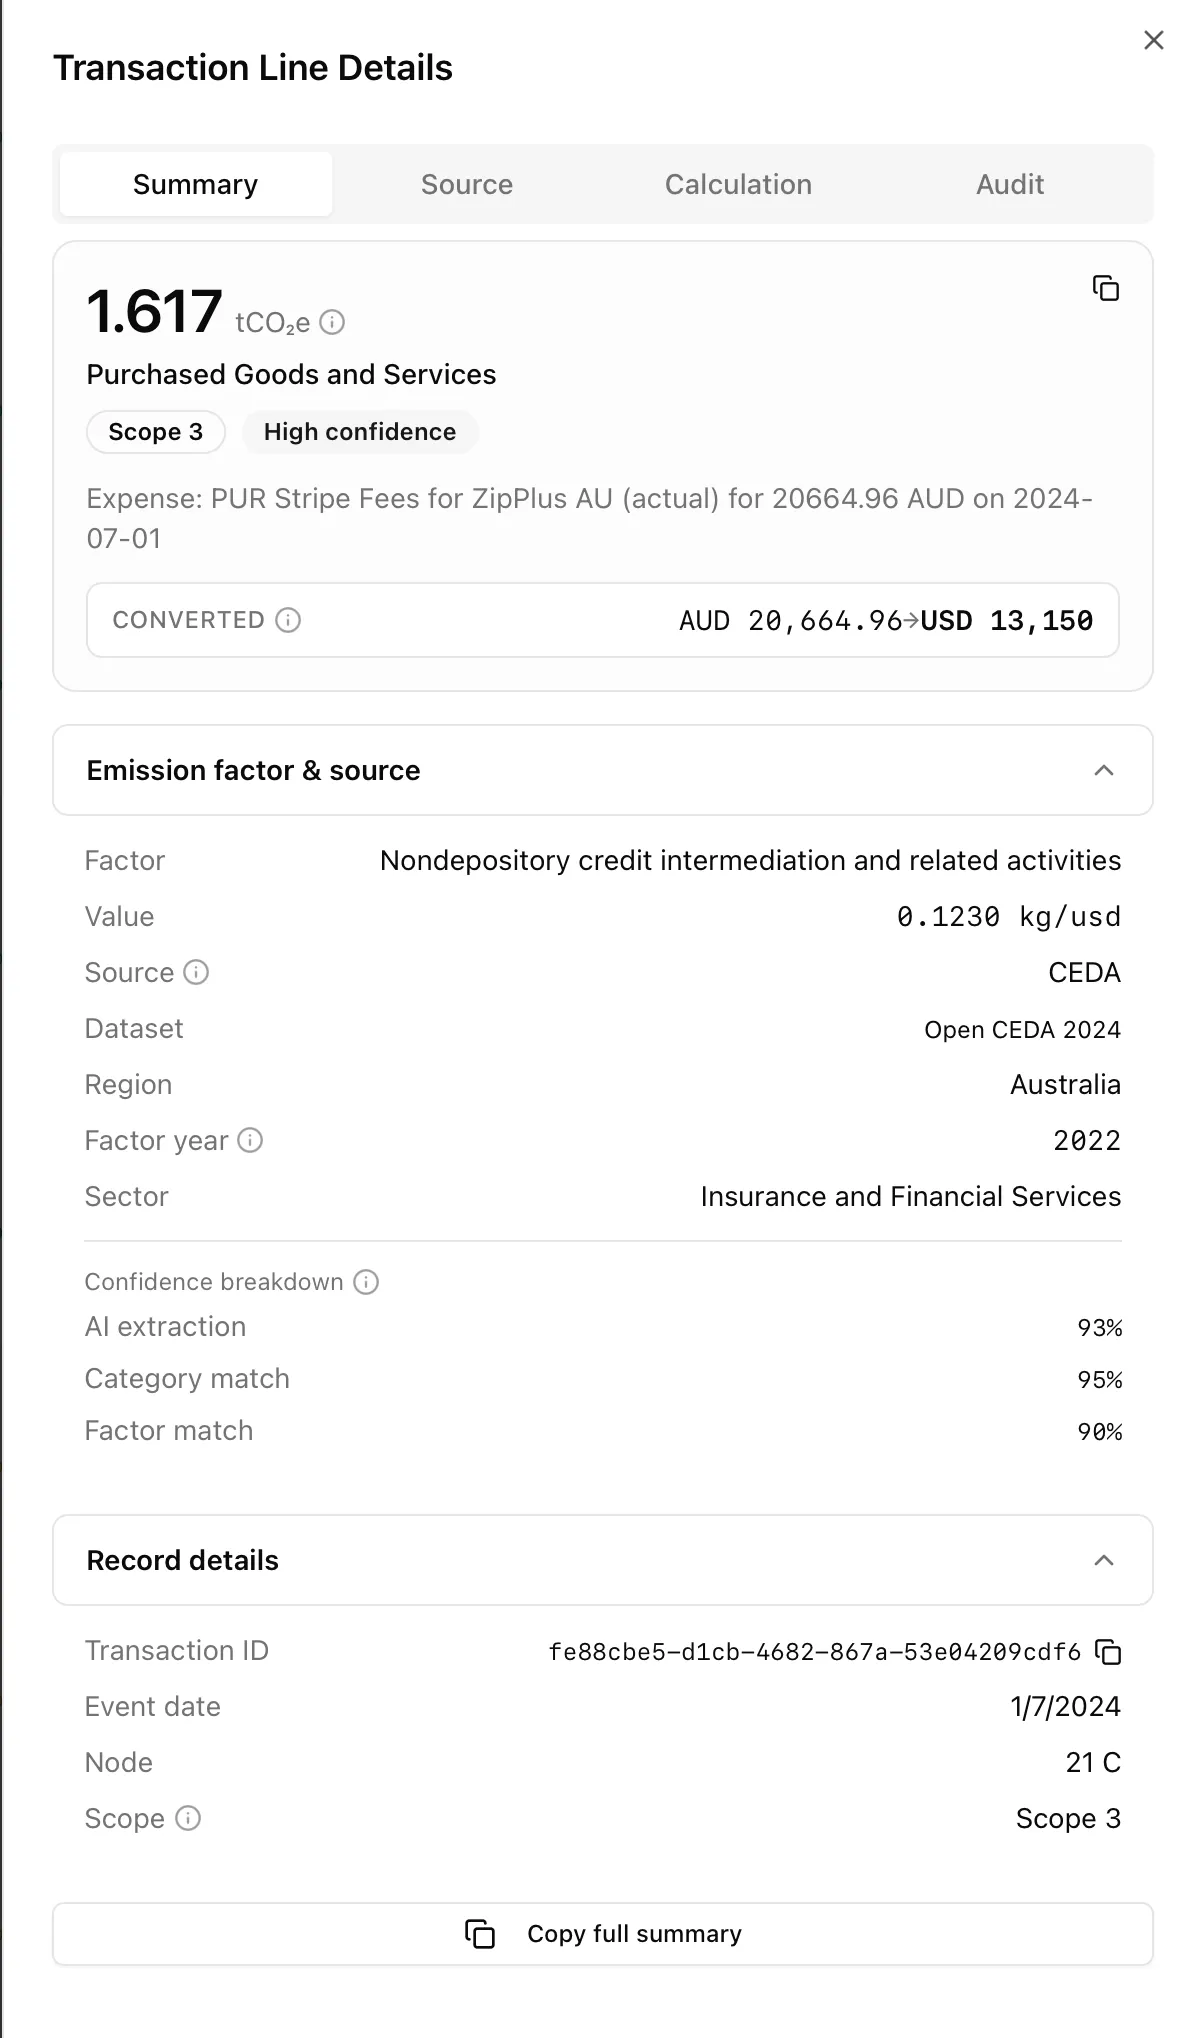
Click 'View Records' to see specific transactions contributing to any supplier's emissions. Access the Carbon Ledger filtered to that vendor for detailed verification and analysis.
Prioritise Engagement
Use rankings to prioritise supplier engagement efforts. Focus on high-impact vendors for primary data requests, EPD collection, and collaborative decarbonisation initiatives.
Why Use Supply Chain Analysis Dashboard
Focus Where It Matters
Stop treating all suppliers equally. The dashboard reveals which vendors drive your supply chain emissions, enabling focused engagement that delivers measurable Scope 3 reductions.
Data-Backed Prioritisation
Replace assumptions with data. Know exactly which suppliers to engage first based on carbon impact, not gut feel or procurement volume alone.
Transition to Primary Data
Start with spend-based estimates, then systematically replace them with supplier-specific EPDs and LCA data. Track your data quality improvement journey.
Sector-Level Insights
Understand which industry sectors contribute most to your supply chain emissions. Identify structural procurement patterns that could shift toward lower-carbon alternatives.
Support Supplier Engagement Programs
Generate the evidence needed to justify supplier engagement investments. Show leadership exactly which vendors should be targeted and why.
Demonstrate Supply Chain Due Diligence
Stakeholders increasingly expect supply chain emissions management. The dashboard provides the visibility needed for investor queries, customer questionnaires, and climate disclosures.
Who Needs Supply Chain Analysis Dashboard
Procurement Managers
Understand the carbon implications of procurement decisions. Identify opportunities to shift spend toward lower-emission suppliers or negotiate emissions reduction commitments.
Sustainability Managers Tackling Scope 3
Scope 3 represents the majority of most organisations' emissions. The dashboard provides the supplier-level visibility needed to develop meaningful reduction strategies.
Supply Chain Sustainability Teams
Dedicated supply chain decarbonisation efforts need clear targeting. Know which suppliers to engage, what data to request, and how to track improvement.
CDP and Climate Disclosure Teams
Supplier engagement is a key CDP scoring criteria. Demonstrate systematic supplier emissions management with data-backed engagement strategies.
Companies Facing Supply Chain Pressure
If your customers are asking about your emissions, you'll soon need to ask your suppliers. Get ahead of downstream requests with proactive supply chain analysis.
Supply Chain Analysis Dashboard Features
Supplier Count
Total number of unique suppliers identified within the selected reporting period. Understand the breadth of your supply chain.
Total Supply Chain Emissions
Absolute carbon footprint (tCO₂e) across all identified vendors. Your aggregate Scope 3 supplier impact.
Supplier Emissions Ranking
Suppliers ranked by total emissions and percentage of total supply chain impact. Quickly identify your highest-impact vendors.
Industry Sector Categorisation
Suppliers grouped by industrial sector (Energy, Buildings and Infrastructure, Food Production, etc.). Understand sector-level emission patterns.
View Records Drill-Down
Click through to examine specific transactions in the Carbon Ledger for any supplier. Verify data, review categorisation, and understand emission calculations.
Facility Filtering
Filter by specific business units or sites to see facility-level supply chain analysis. Understand how procurement varies across your organisation.
Date Range Selection
Analyse specific time periods for cross-period comparisons. Track how supplier emissions change year-over-year.
Export Functionality
Download supplier rankings as CSV or Excel for offline analysis, supplier engagement planning, and board reporting.
See It in Action
Identify your highest-impact suppliers, verify the transactions behind their emissions, and turn that insight into targeted engagement.
Real Results from Real Users
See how companies are transforming their sustainability reporting
"We suspected our IT vendors were significant, but the Supply Chain Analysis showed they were 45% of our Scope 3. That data justified a dedicated IT sustainability program and engagement with our top 5 technology partners."
- Identified IT sector as 45% of Scope 3
- Prioritised top 5 IT vendors for engagement
- Collected primary data from 3 key partners
"The 80/20 insight was real for us—just 12 suppliers represented 78% of our supply chain emissions. Instead of engaging 500+ vendors, we focused intensively on those 12. Much more manageable."
- 12 suppliers = 78% of supply chain emissions
- Focused engagement dramatically improved
- EPD collection from 8 of 12 priority suppliers
"The sector categorisation revealed that food and beverage suppliers were our biggest category—not surprising for hospitality, but now we had the data to drive menu sustainability initiatives."
- Food & beverage identified as top sector
- Menu sustainability initiatives launched
- Supplier switching tracked over time
Frequently Asked Questions
Everything you need to know about Supply Chain Analysis Dashboard
Related Features
Supplier Emissions Tracker
Engage suppliers systematically to collect primary emissions data. Replace spend-based estimates with verified supplier-specific figures.
Learn moreCustom Emission Factors (EPD/LCA)
Apply supplier-specific emission factors from EPDs and LCAs. Improve calculation accuracy for high-impact suppliers.
Learn moreScope 3 Emissions Calculator
Calculate complete Scope 3 emissions across all 15 categories. Supply chain analysis feeds into your comprehensive value chain footprint.
Learn moreAudit Trail & Carbon Ledger
Review supplier transactions at line-item level. Verify categorisation, check emission factors, and consolidate duplicate supplier entries.
Learn moreKnow Your Supply Chain Emissions
Identify. Prioritise. Engage.
Stop guessing which suppliers matter most for your carbon footprint. NetNada's Supply Chain Analysis dashboard reveals your highest-impact vendors so you can focus engagement where it drives real Scope 3 reductions.