CAWSYD26 Sustainability Impact Report | Climate Action Week Sydney 2026


Why measure the footprint of a climate event?
Climate Action Week Sydney (CAWSYD) exists to accelerate climate action. But how do you know if the event itself is walking the talk?
For the second time, CAWSYD partnered with NetNada to turn the lens inward — surveying how 13,350 attendees travelled across the city, and asking partner venues to share their sustainability credentials. The result is a transparency baseline that will guide decisions for CAWSYD27 and beyond.
This post summarises what we found.
The numbers at a glance
Across the full week of CAWSYD26:
- 228 events were held across Sydney, with 92 events at partner venues (40% of the total)
- ~5 tonnes CO₂e estimated from local attendee transport
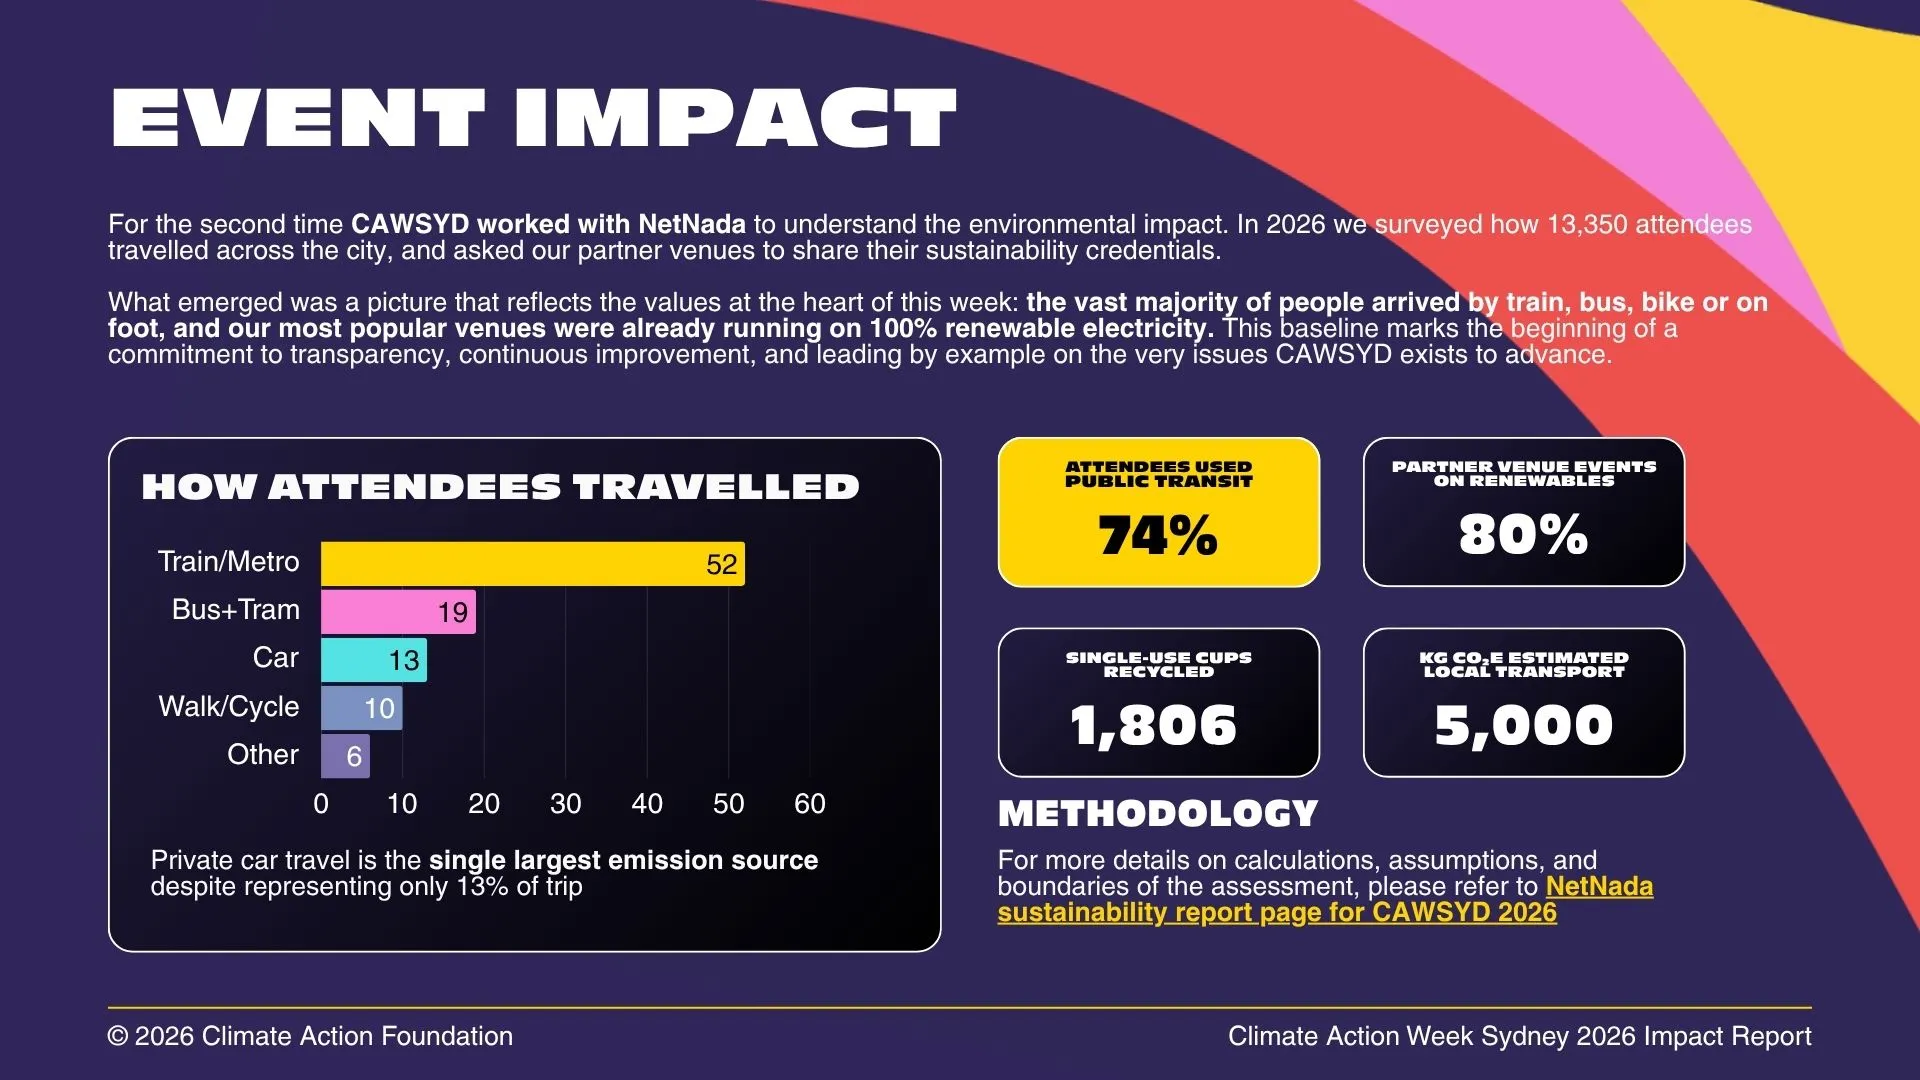
- 74% of attendees used public transit (train, metro, bus or tram)
- 37% of all trips were zero or near-zero emission — walking, cycling, e-bike, or attending online
- 80% of partner venue events ran on confirmed 100% renewable electricity
How attendees travelled
Transport is often the largest emissions source for any event. At CAWSYD26, the breakdown of how attendees got to events looked like this:
- Train and Metro: 52% — by far the dominant mode, reflecting the CBD-centric venue locations near major rail hubs
- Bus and Tram: 19% — contributing to the 74% public transit total
- Walking and Cycling: 10% — enabled by venues like UTS, which offers e-bike charging stations and bike racks on campus
- Private Car: 13% — despite being a relatively small share of trips, car travel accounted for the majority of the ~5 tCO₂e transport total
- Other (including online): 6%
The average attendee visited 3.4 events during the week. Even so, the per-attendee transport footprint came in at under 0.5 kg CO₂e per trip — a figure that reflects the overwhelmingly public-transport-oriented travel patterns.
The takeaway is clear: venue location matters. Choosing venues close to major transit hubs — like Central Station — directly shapes the emissions profile of the entire event.
Partner venue sustainability
CAWSYD26 had five partner venues hosting 92 events. We sent sustainability questionnaires to each, asking about energy, waste, transport infrastructure, and building credentials. Here’s what came back.
UTS — Great Hall and Startups (49 events)
UTS Building 2, home to the Great Hall, holds a verified 6-star NABERS Energy rating — the maximum achievable under Australia’s most recognised building performance scheme.
Key credentials:
- 100% renewable electricity across the entire UTS campus
- Energy-efficient lighting and occupancy-responsive air conditioning (demand-driven, not on a fixed schedule)
- Full organic waste separation and composting
- 100% compostable containers and recyclable serviceware — zero plastics in catering
- E-bike charging stations and bike racks on campus
- Two-minute walk from Central Station
UTS Startups, also on campus, shares the same renewable electricity and waste infrastructure.
Greenhouse — 180 George St, Sydney Place (25 events)
Greenhouse operates within a building that holds a 6-star Green Star Design Rating and WELL Platinum certification (Shell and Core). The venue itself is targeting a 5.5-star NABERS Energy rating.
What stood out:
- 100% GreenPower-certified renewable electricity via Flow Power
- Participating in a “true zero” initiative — real-time matching of electricity consumption with renewable generation or battery storage, 24 hours a day. This goes beyond standard net-zero approaches that rely on annual offsets
- Deployed the CERCLE reusable cup and plate program for the full event week: 745 coffees served across 1,806 attendees, with approximately 575 reusable cups in circulation (235 coffee, 340 water) — eliminating single-use disposables at the venue entirely
- Fit-out sourced from sustainable and circular suppliers including DesignByThem, Reddie, and Defy Design
Canva (8 events)
Canva provided a partial response. The venue contact was unable to confirm NABERS ratings or specific energy measures, though Canva has broader corporate sustainability commitments available publicly. Notably, Canva’s offices have no on-site parking, which naturally encourages public transport use. The venue also maintains rooftop beehives as part of its broader sustainability initiatives.
EnergyLabs (10 events)
EnergyLabs did not respond to the sustainability questionnaire by the reporting deadline. This represents a data gap that we recommend addressing for CAWSYD27 by embedding the questionnaire into the partner onboarding process rather than requesting it post-event.
Energy emissions from partner venues
We estimated Scope 2 (electricity) emissions for the 92 partner venue events using the GHG Protocol market-based accounting method. Under this approach, venues with confirmed 100% renewable electricity procurement report zero emissions.
UTS and Greenhouse: zero market-based Scope 2 emissions. These two venues hosted 74 of the 92 partner venue events (80%), all under confirmed renewable electricity. That’s a direct result of intentional venue selection by the CAWSYD team.
For EnergyLabs and Canva, without confirmed renewable procurement, we applied the NSW grid average emission factor (0.74 kg CO₂e per kWh). Based on conservative power load assumptions (8–25 kW per venue, 2 hours per event including bump-in and bump-out), the total estimated Scope 2 emissions across all partner venues came in at just 341 kg CO₂e — with the entirety coming from the two venues without confirmed renewables.
If either EnergyLabs or Canva confirms renewable electricity procurement, the partner venue energy footprint would drop further — potentially to near-zero.
What this means for CAWSYD27
This was a baseline exercise, and baselines are only useful if they lead to action. Here’s what the data points to:
What’s working:
- Venue selection is already aligned with sustainability outcomes — the two highest-volume venues operate at or near market-leading building performance tiers
- The attendee base overwhelmingly favours public transport, keeping per-trip emissions well below 0.5 kg CO₂e
- Initiatives like the CERCLE reusable cup program at Greenhouse demonstrate that zero-waste catering at event scale is practical, not aspirational
Where to improve:
- Close the data gaps. Two of five partner venues couldn’t or didn’t provide sustainability credentials. Embedding the questionnaire into partner agreements at onboarding — not after the event — would address this
- Target car travel. At 13% of trips but the majority of transport emissions, private car use is the clearest lever. Better signposting of public transport options, and prioritising venues near rail, would help
- Expand venue reporting. Future reports could include water use, waste diversion rates, and Scope 3 (supply chain) data as venues mature their own measurement practices
Methodology and data sources
Transparency means showing the working, not just the results. Below is a summary of the methodology used to calculate both transport and venue energy emissions for CAWSYD26.
Scope and standards
Two emission categories were measured:
- Scope 3 — Attendee transport emissions: Greenhouse gas emissions from attendees travelling to and from CAWSYD26 events across Greater Sydney
- Scope 2 — Venue energy emissions: Electricity consumption at the four CAWSYD26 partner venues during event programming
All calculations follow the GHG Protocol Corporate Value Chain (Scope 3) Standard and the GHG Protocol Scope 2 Guidance (market-based and location-based methods). The emissions boundary covers local Sydney transport only — interstate and international travel is excluded from CAWSYD26 and will be considered for inclusion in future years.
Transport emissions — how we calculated
Survey data and scaling. The CAWSYD26 Event Attendee Feedback Survey collected 168 valid responses covering mode of transport and number of events attended. Responses were scaled proportionally to the full 13,350 registered attendees (scale factor: 79.5×).
Respondents could select multiple transport modes (e.g. Train + Walk), so mode-share percentages reflect the proportion who used each mode at least once, not mutually exclusive journey shares.
Events per attendee. Respondents selected from three bands. Using weighted midpoints:
| Band | Midpoint | Respondents | Weighted contribution |
|---|---|---|---|
| 1–2 events | 1.5 | 80 | 120 |
| 3–5 events | 4.0 | 65 | 260 |
| 6–10 events | 8.0 | 23 | 184 |
| Total | 168 | 564 |
Weighted average: 3.4 events per attendee.
Trip distances. Average one-way distances are based on ABS 2021 Census Journey to Work data for Sydney, combined with the known distribution of CAWSYD26 venues across Greater Sydney (105 venues including locations outside the CBD).
| Mode | One-way distance | Rationale |
|---|---|---|
| Train / Metro | 8 km | Sydney average CBD-bound rail commute |
| Bus | 8 km | Similar catchment to train |
| Light Rail / Tram | 6 km | Primarily inner-city routes |
| Ferry | 12 km | Sydney Ferries routes (Manly, Parramatta) |
| Car (driver or passenger) | 18 km | Sydney average car commute; ABS JTW 2021 |
| EV | 18 km | Same distance as car; different emission factor |
| Rideshare / Taxi | 15 km | Inner-city point-to-point |
| Bicycle / E-bike / Scooter | 5 km | Typical active transport range |
| Walk | 2 km | Short-distance access; zero emissions |
| Online | 0 km | No physical travel |
All distances applied as return trips (one-way × 2).
Emission factors. All factors in kg CO₂e per passenger-kilometre, sourced from Australian NGER 2023–24 and Transport for NSW:
| Mode | EF (kg CO₂e/pkm) | Source |
|---|---|---|
| Train / Metro | 0.037 | Transport for NSW 2023 |
| Bus | 0.075 | Transport for NSW 2023 |
| Light Rail / Tram | 0.032 | Transport for NSW 2023 |
| Ferry | 0.120 | Transport for NSW 2023 |
| Car — solo driver | 0.192 | NGER 2023–24; ATA/NTI Fleet EF |
| Car — passenger | 0.120 | NGER 2023–24; 1.6 avg occupancy |
| EV (NSW grid) | 0.058 | NGER 2023–24 grid intensity × EV efficiency |
| Rideshare / Taxi | 0.150 | NGER 2023–24 light vehicle |
| Bicycle / E-bike / Scooter | 0.005 | Lifecycle manufacturing only |
| Walk | 0.000 | Zero operational emissions |
Formula per mode: CO₂e = respondents × scale factor × emission factor × distance × 2
Venue energy emissions — how we calculated
Scope. Scope 2 electricity consumption for the 92 partner venue events only. Non-partner venues (136 events at 65+ other venues) are excluded due to absence of venue-level data.
Assumptions:
- Event duration: 2 hours including bump-in/out (conservative average across a mixed program)
- Electricity intensity: 0.035 kWh/m²/hour (AIRAH DA19 HVAC benchmark for commercial assembly spaces — covers HVAC and general lighting during occupancy)
- Floor areas estimated from publicly available capacity data and commercial benchmarks
Emission factors:
- Market-based (UTS, Greenhouse): 0 kg CO₂e/kWh — both confirmed 100% renewable electricity procurement
- Location-based (Canva, EnergyLabs): 0.290 kg CO₂e/kWh — NSW grid average (NGER 2023–24)
| Venue | Events | Area (m²) | Total kWh | EF (kg/kWh) | CO₂e |
|---|---|---|---|---|---|
| UTS (Great Hall + Startups) | 49 | 600 | 2,058 | 0.000 | 0 kg |
| Greenhouse | 25 | 400 | 700 | 0.000 | 0 kg |
| Canva | 8 | 300 | 168 | 0.290 | ~49 kg |
| EnergyLabs | 10 | 250 | 175 | 0.290 | ~51 kg |
| Total | 92 | 3,101 kWh | ~100 kg CO₂e |
Limitations and uncertainties
- Survey sample size: 168 responses from 13,350 registrations (1.3% response rate). Mode share patterns are directionally reliable but scaled totals carry uncertainty
- Multi-modal trips: Selecting both Train and Walk results in emissions calculated independently for each, potentially double-counting some multi-leg journeys
- Average distances: Sydney-wide averages that don’t account for individual attendee origins; regional events may involve longer journeys
- Venue floor areas: Estimates, not verified measurements; ±30% variance would change venue totals proportionally but not the overall picture given renewable profiles
- Data gaps: EnergyLabs (no response) and Canva (partial response) use conservative grid defaults
- Excluded categories: Catering, food waste, embodied carbon in event materials, speaker travel, volunteer transport, and waste-to-landfill emissions are not included in this reporting period
Published data sources
- Australian NGER Measurement Determination 2023–24 (Clean Energy Regulator)
- Transport for NSW — Average Occupancy and Emissions Report 2023
- ABS 2021 Census — Journey to Work
- AIRAH DA19 HVAC Design Guidelines
- GHG Protocol Scope 2 Guidance
- Green Building Council of Australia — Green Star
- NABERS energy rating scale
A commitment to transparency
CAWSYD exists to advance climate action. Measuring our own footprint — honestly, including the gaps — is part of that mission.
Working with NetNada as a Climate Active Registered Sustainability Consultant, we’ve established a repeatable methodology that will improve year on year. The picture that emerged from CAWSYD26 reflects the values at the heart of this week: the vast majority of people arrived by train, bus, bike or on foot, and our most popular venues were already running on 100% renewable electricity.
This baseline marks a commitment to continuous improvement and leading by example on the very issues Climate Action Week Sydney exists to advance.
This post summarises findings from the CAWSYD26 Partner Venue Sustainability Report and Transport Impact Analysis, prepared by NetNada Sustainability Consulting based on venue responses sourced by Lauren Houghton (CAW), March 2026. The full report is available as a supplement to the Climate Action Week Sydney 2026 Impact Report.
Build Your Sustainability Strategy
From measurement to target-setting to reporting, NetNada provides the complete platform for your sustainability journey.